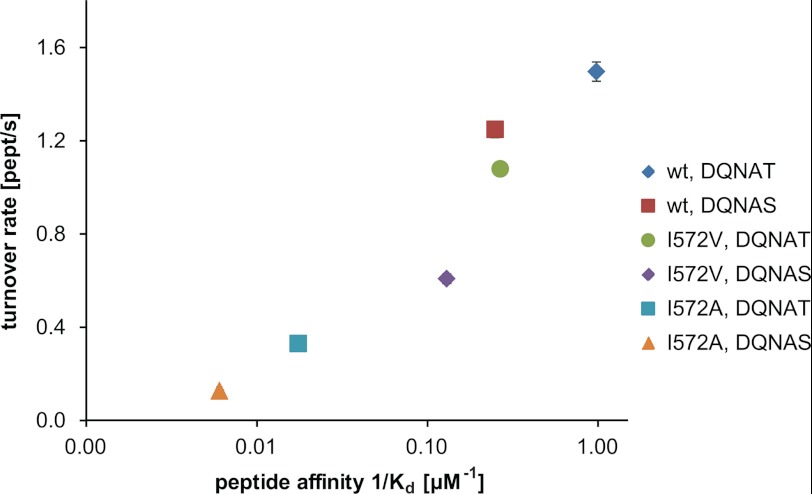
FIGURE 7.
Correlation of peptide binding and glycosylation turnover. Values for peptide binding and turnover rates presented in Fig. 4C are correlated in a two-dimensional plot. Peptide binding is presented as log (1/Kd). Error bars indicate the S.E. of each fit, but are smaller than the symbols in most cases.

