FIGURE 1.
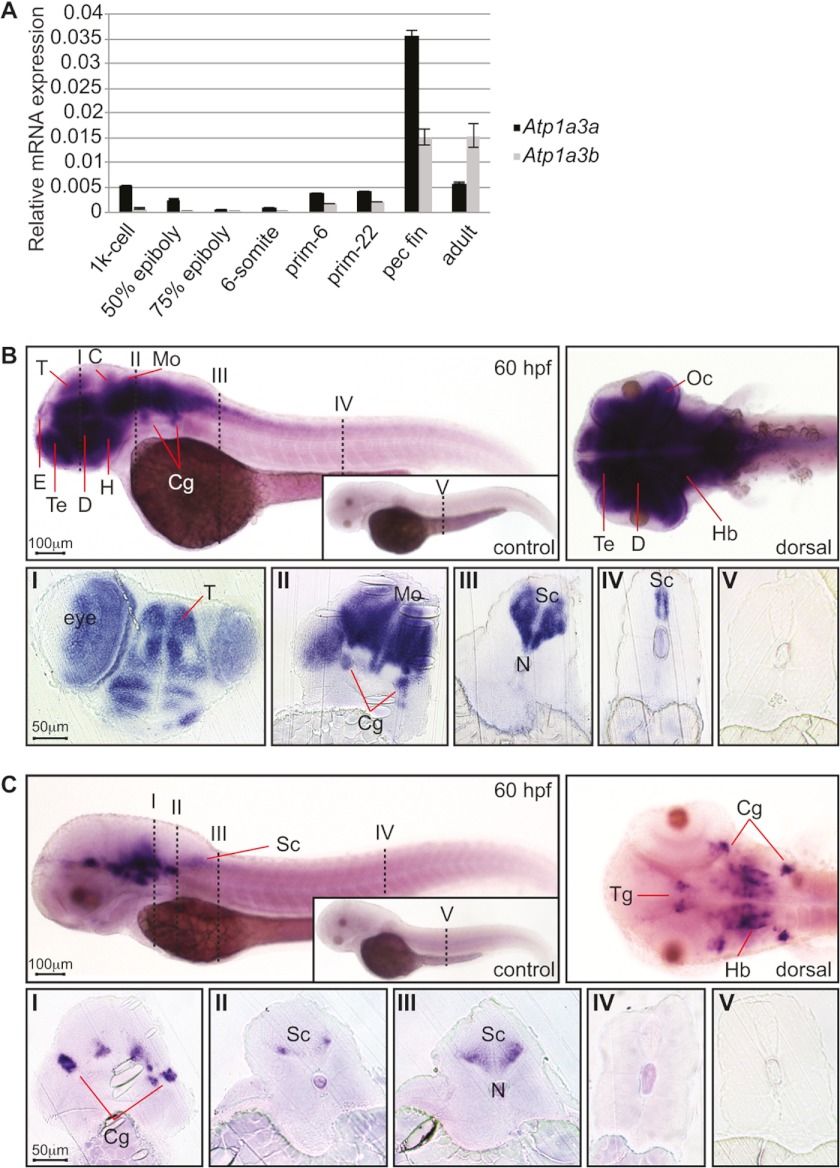
Expression of Atp1a3a and Atp1a3b mRNA in zebrafish embryos. A, Atp1a3a (black bars) and Atp1a3b (gray bars) mRNA expressions were quantified by qRT-PCR and normalized to Actb2 expression. Data are presented as mean ± S.E. of triplicate measurements. B, Atp1a3a mRNA expression analyzed by whole-mount in situ hybridization in 60 hpf zebrafish embryos; the inset shows sense probe hybridized control embryo. Atp1a3a is expressed in the brain and the spinal cord. The numbered vertical dashed lines, here and in C, show the positions of the transverse sections shown below in sections I–V. The abbreviations used are: C: cerebellum; Cg: cranial ganglia; D: diencephalon; E: epiphysis; H: hypothalamus; Hb: hindbrain; Mo: medulla oblongata; N: notochord; Oc: optic cup; T: tectum; Te: telencephalon; Tg: tegmentum; Sc: spinal cord. Scale bars represent 100 μm in whole-mount images and 50 μm in sections. C, Atp1a3b mRNA expression analyzed by whole-mount in situ hybridization in 60 hpf zebrafish embryos; the inset shows sense probe hybridized control embryo. Atp1a3b is expressed in specific brain regions.

