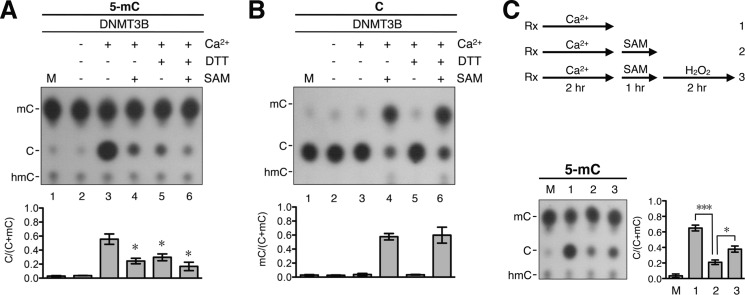
FIGURE 4.
Inhibition effects of reducing reagents and SAM on DNA demethylation activity of DNMT3B. A, the 5-mC-containing DNA substrate was subjected to the demethylation reactions with 40 nm recombinant DNMT3B in buffer B containing 100 μg/ml BSA with or without the inclusion of 1 mm CaCl2, 5 mm DTT, or 160 μm SAM. After incubation at 37 °C for 4 h, the DNA products were analyzed by the hydrolysis-TLC assay. The results are presented quantitatively in the histogram. Error bars indicate S.D. *, p < 0.05 by t test comparing bars 4–6 with bar 3. B, unmethylated pMR1-8 plasmid DNA was incubated with 40 nm recombinant DNMT3B in buffer B containing 100 μg/ml BSA with or without 1 mm CaCl2, 5 mm DTT, or 160 μm SAM. After incubation at 37 °C for 4 h, the extent of C methylation of the DNAs from the different reactions was determined by the hydrolysis-TLC assay and is compared quantitatively in the histogram. Error bars indicate S.D. C, strategy of a series of reactions testing the reversibility of DNA demethylation and methylation (see “Results” for more details). Briefly, the 5-mC-containing DNA substrate was incubated at 37 °C for 2 h with 40 nm recombinant DNMT3B in buffer B containing 100 μg/ml BSA and 1 mm CaCl2 (reaction 1). Then, 160 μm SAM was added, and the incubation was continued for another 1 h (reaction 2). Finally, 1 mm H2O2 was added to the reaction mixture, and the incubation was continued for another 2 h (reaction 3). Rx, reactions. The DNA products from the three reactions outlined in the upper panel were purified and analyzed by the hydrolysis-TLC assay. The data are quantitatively compared in the histogram. M, mock control without incubation. Error bars indicate S.D. *, p < 0.05; ***, p < 0.005.

