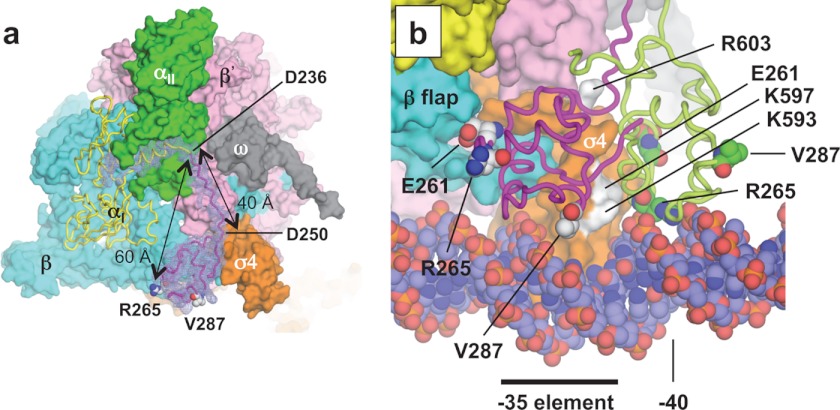
FIGURE 5.
α-CTD structure. a, difference (Fo − Fc) electron density map between the holoenzyme and holoenzyme without αI residues 215–315 (including the last α-NTD α helix, linker, and α-CTD), shown in mesh, overlaid on the final holoenzyme structure (αII, β, β′, ω, and σ, surface representation; and αI, ribbon model). The positions of two key residues for DNA (Arg-265) and transcription factor (Val-287) interaction on the α-CTD are indicated. Glu-261, another key residue of the α-CTD for the σ4 interaction, positioned between the α-CTD and β subunit, cannot be seen from this view. The distance between the α-NTD and Arg-295 and the length of the linker are shown. b, superimposed holoenzyme crystal structure (this study) and holoenzyme·catabolite activator protein·DNA model (Protein Data Bank code 3IYD). The two structures were aligned by superimposing their σ4 domains. The α-CTD from the crystal structure (magenta) and the model (light green) are shown as ribbons, and key α-CTD residues are shown as spheres. Surface-exposed σ4.2 residues that are predicted for direct interaction with the α-CTD are colored white and are indicated.

