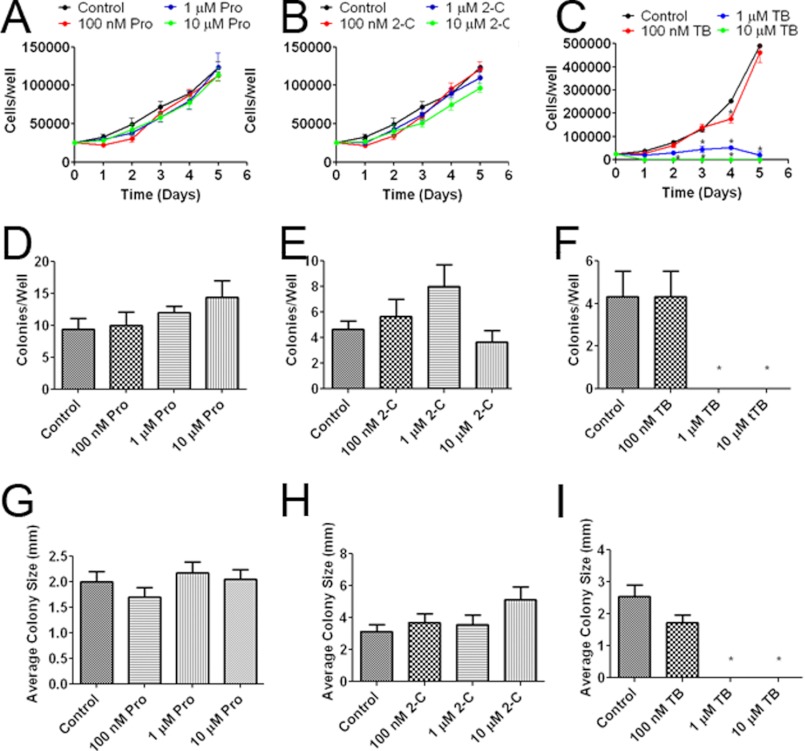
FIGURE 7.
The effects of MB derivatives on glioma proliferation and colony formation. A, shown is the U87 growth curve with cells treated with 100 nm, 1 μm, and 10 μm Pro. B, shown is the U87 growth curve with cells treated with 100 nm, 1 μm, and 10 μm 2-C. C, shown is U87 cell growth with cells treated with 100 nm, 1 μm, and 10 μm TB. TB inhibited cell growth at concentrations of 1 and 10 μm. * indicates p < 0.05 by 2-way ANOVA and Bonferroni post-hoc test. At concentrations of 100 nm, 1 μm, and 10 μm, Pro had no effect on either number (D) or size of the colonies in liquid colony formation assay (G). Similarly, no effect was observed upon 2-C treatment on either number (E) or size of the colonies (H). TB at 1 and 10 μm significantly decreased both number (F) and size of the colonies (I). * indicated p < 0.05 by 1-way ANOVA and Tukey's post-hoc test.

