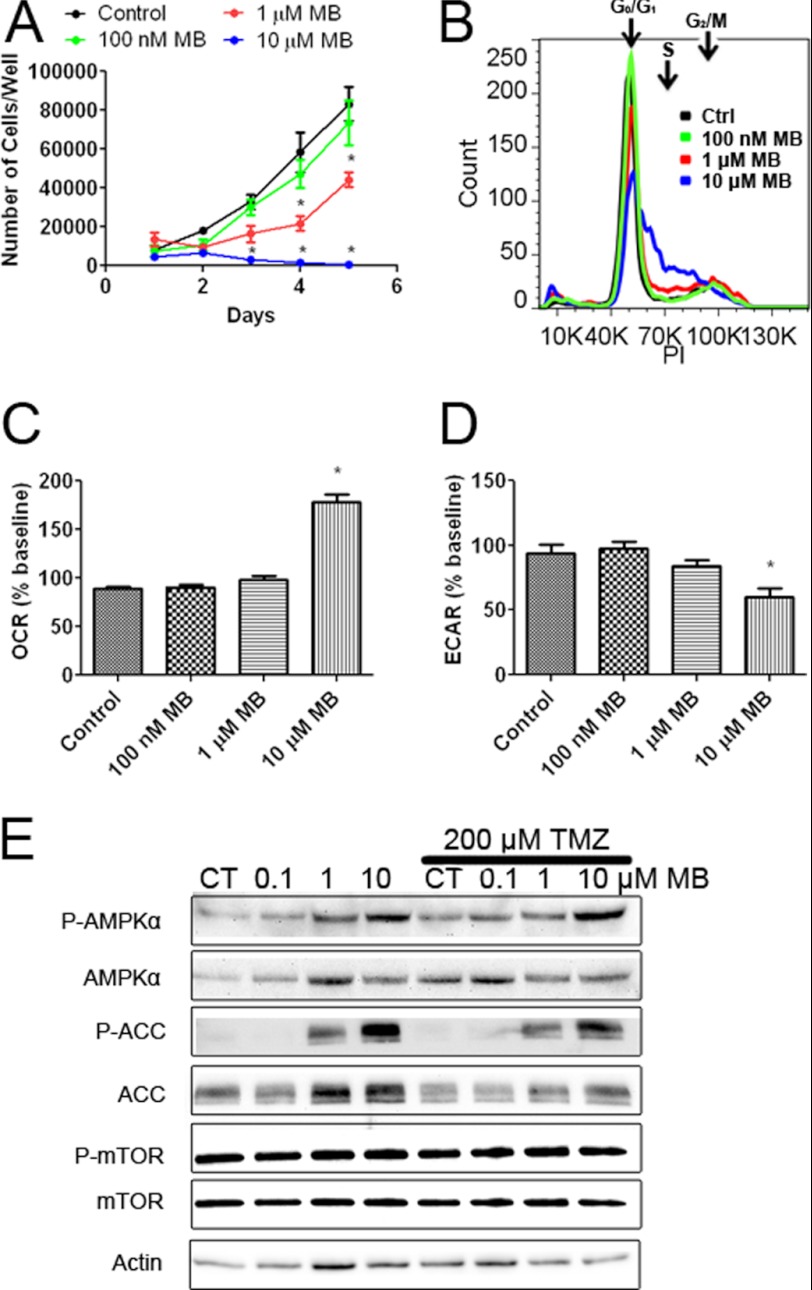
FIGURE 9.
MB impairs TMZ-insensitive glioma cell proliferation. A, the growth curve of T98G cells treated with 100 nm, 1 μm, and 10 μm MB is shown. * indicates p < 0.05 by 2-way ANOVA and Bonferroni post-hoc test. B, representative cell cycle analysis of T98G cells treated with media (black), 100 nm MB (blue), 1 μm MB (orange), or 10 μm MB (green) for 2 days is shown. Both 1 and 10 μm MB decreased G1 phase while increasing S phase. C, OCR of T98G cells treated with 100 nm, 1 μm, or 10 μm MB is shown. 10 μm MB significantly increased OCR compared with control. * indicated p < 0.05 by 1-way ANOVA and Tukey's post-hoc test. D, ECAR of T98G cells treated with 100 nm, 1 μm, or 10 μm MB is shown. 10 μm MB significantly decreased ECAR compared with control. * indicated p < 0.05 by 1-way ANOVA and Tukey's post-hoc test. E, Western blot analysis of AMPKα, ACC, and mTOR is shown. Increased phosphorylation of AMPKα and ACC was observed with no discernable change in mTOR phosphorylation. CT, control.

