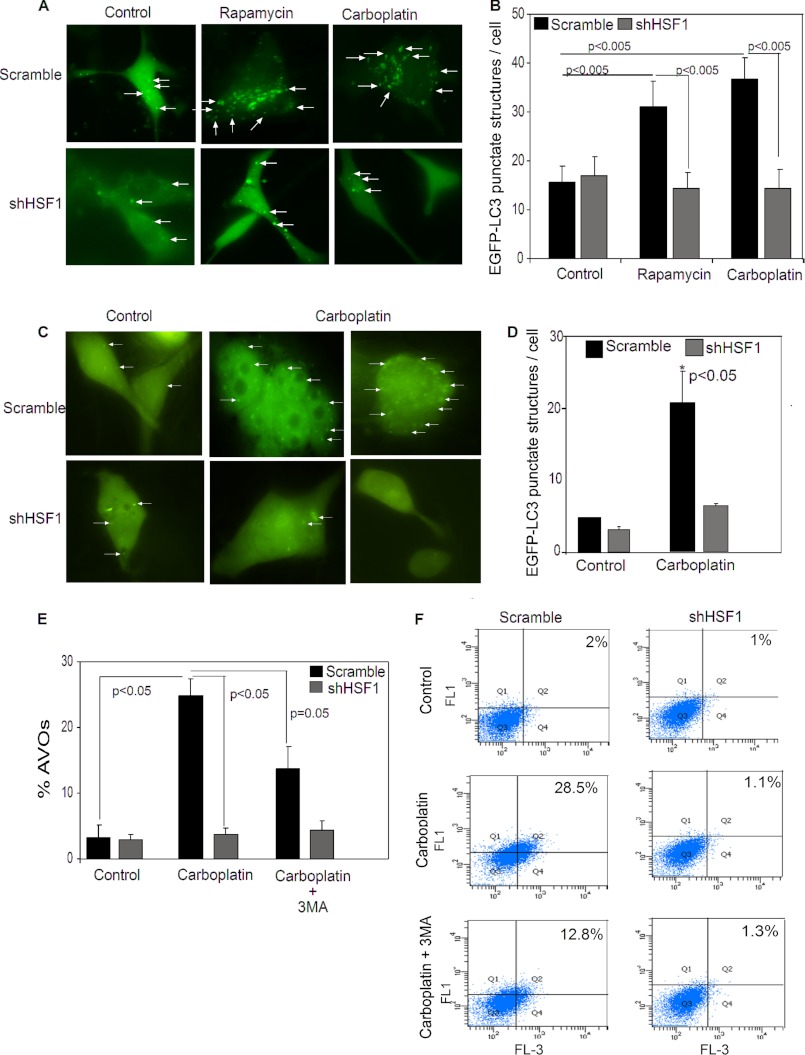
FIGURE 2.
HSF1 influences induction of autophagy in breast cancer cells. A, microscopy of punctate EGFP-LC3 in scramble and HSF1-knockdown MDA-MB-231 cells in untreated (control) or treated with 10 nm rapamycin or 75 μg/ml carboplatin for 24 h. Magnification, ×60. White arrows, punctate EGFP-LC3 structures. B, bar graph represents average EGFP-LC3 punctate structures per cell in MDA-MB-231 cells expressing HSF1 (black bars) or HSF1-knockdowns (gray bars), upon treatment with rapamycin or carboplatin. Error bars, S.E. Data were collected for two independent experiments, and at least 10 images per slide were analyzed for each condition. C, microscopy of punctate EGFP-LC3 in presence or absence of HSF1 in MDA-MB-436 cells untreated (control) or treated with 75 μg/ml carboplatin for 24 h. Magnification, ×60. D, average EGFP-LC3 punctate structures per cell in MDA-MB-436 cells expressing HSF1 (black bars) or HSF1-knockdown (gray bars), upon treatment with carboplatin. Error bars, S.E. Data for three independent experiments and at least 30 cells for rapamycin treatment and carboplatin treatment were analyzed for each condition. *, p < 0.05). Flow cytometry of acridine orange staining of AVO in scramble and stable HSF1-knockdown MDA-MB-231 cells after treatment with 75 μg/ml carboplatin and carboplatin and 3-MA for 24 h is shown. E, mean AVO-positive cells (n = 3). Error bars, S.E. F, representative flow cytometric profile of AVO-positive cells. FL1 detects green intensity, and FL3 detects red intensity. Cells in right quadrants were considered AVO-positive.

