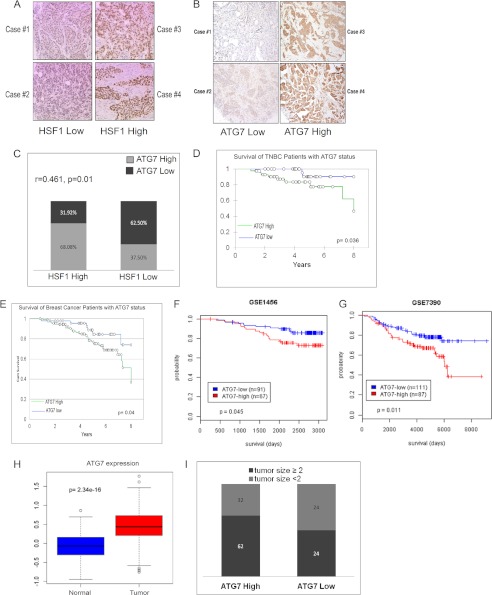
FIGURE 6.
Atg7-high tumors associated with decreased survival in breast cancer patients. A and B, immunohistochemical staining of breast cancer patient samples for HSF1 (A) and ATG7 (B). C, correlation between expression of HSF1 and ATG7 in the TNBC patient samples. Tetrachoric correlation coefficient is shown along with log p value. D, Kaplan-Meier analysis of TNBC individuals scored for the ATG7 status in the study. E, Kaplan-Meier analysis of all individuals scored for the ATG7 status in the study. F and G, survival analysis for breast cancer patient based on ATG7 status using the GSE7390 database (F) and using the GSE1456 database (G). Log-rank p value is shown. H, box plot for expression of ATG7 in normal and tumor tissue using TCGA database. I, distribution of breast cancer patients with large tumor size (≥2) and small tumor size (<2) expressing different levels of ATG7.

