FIGURE 5.
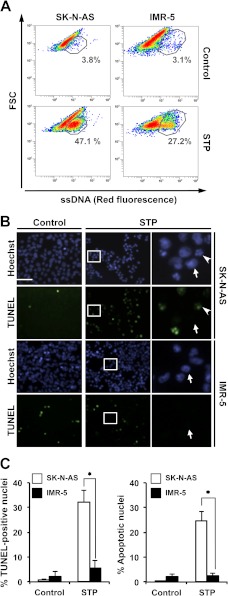
The absence of stage II nuclear morphology in injured IMR-5 cells correlates with reduced DNA damage in 3′-OH SSBs. SK-N-AS and IMR-5 cells were left untreated (Control) or treated with 1 μm STP for 6 h. A, flow cytometry analysis of ssDNA damage using the monoclonal antibody F7-26. Data are shown as density plots representing size (y axis, in a logarithm scale) versus intensity of red fluorescence (x axis, in a logarithm scale). FSC, forward scatter of light. Cell density (events) is shown on a pseudocolor scale from minimum density (blue) to maximum density (red). The circled populations correspond to cells presenting ssDNA damage. The percentage of gated cells in each condition is indicated. The experiment was repeated three times with a low variability (< 10%). B, TUNEL reactivity and Hoechst nuclear staining in SK-N-AS or IMR-5 cells untreated (Control) or treated with STP. The right panels are magnifications of the insets in the center panels. The arrows show stage I nuclei negative for TUNEL reactivity. The arrowheads indicate representative apoptotic stage II and TUNEL-positive nuclei. Scale bar = 40 μm. C, quantification of the data presented in B representing TUNEL-positive nuclei (left panel) and apoptotic nuclei (right panel) in SK-N-AS (white bars) and IMR-5 (black bars) cells upon STP treatment. The means ± S.E. of three independent experiments are represented. Asterisks indicate p ≤ 0.01.

