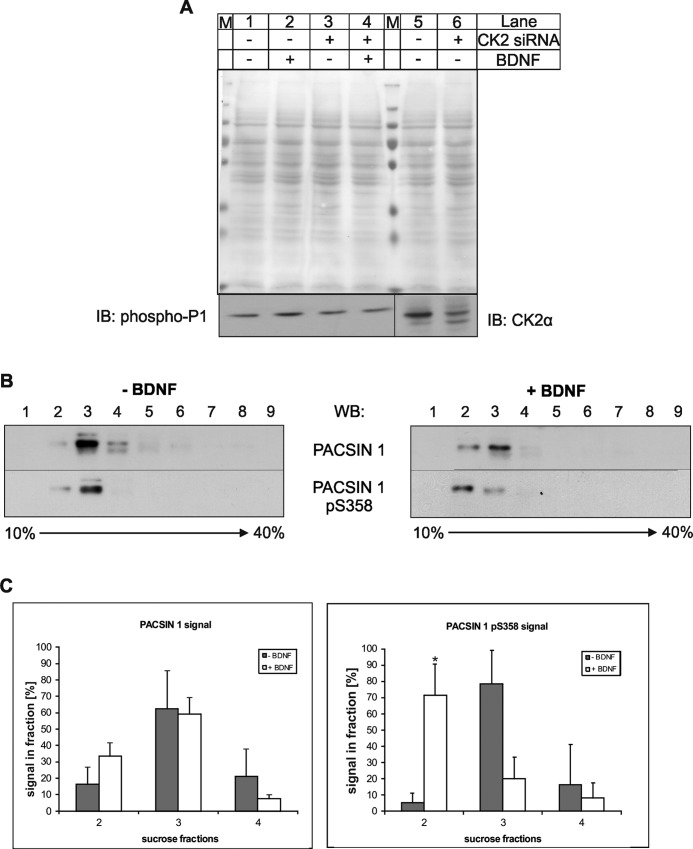
FIGURE 3.
Phospho-PACSIN 1 levels and localization in neuronal cells. A, N2a cells were transfected with a CK2α-specific siRNA mixture for 72 h and then incubated with (+) or without (−) BDNF (100 ng/ml) for 5 h and lysed. Comparable amounts of the individual lysates (50 μg/lane) were resolved by SDS-PAGE and immunoblotted (IB) with antibodies specific for the indicated proteins. As a control, the Ponceau staining of the membrane is shown. M, marker proteins. B, protein extracts from cultured mouse hippocampal neurons were subjected to centrifugation through a continuous sucrose density gradient and fractions analyzed for the distribution of total and phosphorylated PACSIN 1. Immunoblot (WB) analysis shows the shift of phosphorylated PACSIN 1 to lighter fractions upon BDNF-treatment of the neurons. C, quantification of immunoblot signal intensities for total (left graph) and phosphorylated (right graph) PACSIN 1 with Image Quant 5.0 for the relevant fractions (2, 3, and 4) of three independent experiments is shown (*, p < 0.05, t test). Error bars, S.D.

