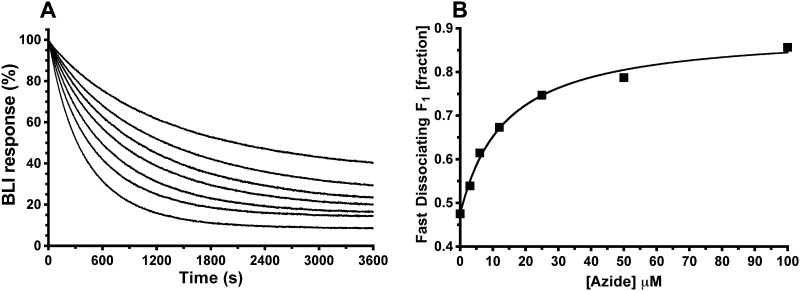
FIGURE 8.
Effects of azide on dissociation of F1 from sensor-bound, wild-type ϵ. A, kinetics for F1·ϵ dissociation measured by BLI. Prior to the F1 dissociation phase shown, BLI sensors had been loaded with biotinylated wild-type ϵ and then incubated for 900 s in buffer with 20 nm F1(−δϵ); the normalized BLI signal at time 0 represents bound F1(−δϵ). Dissociation of F1(−δϵ) from immobilized ϵ was done in hydrolysis conditions (1 mm ATP, 2 mm Mg2+) with increasing concentrations of azide, as indicated. Dissociation kinetics were biphasic, with “fast” (1–2.5 × 10⁻³ s−1) and “slow” (0.8–1.6 × 10⁻⁴ s−1) fractions (nonlinear regression fits not shown but essentially superimpose with data at scale shown; R2 > 0.9995 for all fits). B, the azide dependence of F1·ϵ dissociation. The fraction of complexes that dissociated fast versus slow shows hyperbolic dependence on azide concentration, with K½ = 14 ± 2.3 μm; R2 = 0.9935.

