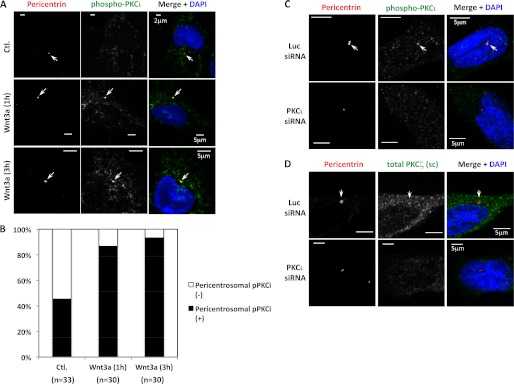
FIGURE 3.

Co-localization of pPKCι and total PKCι with the centrosomal marker pericentrin. A, confocal micrographs of TC-32 cells treated in the absence or presence of Wnt3a (100 ng/ml) for the indicated times and subsequently stained with DAPI and antibodies to pPKCζ/ι and pericentrin. Arrows point to centrosomes. B, percentage of cells in different treatment groups with pericentrosomal distribution of pPKCι. The cumulative number (n) of cells analyzed in more than three experiments is indicated. Wnt3a treatment for 1 and 3 h increased the percentage of cells with pericentrosomal distribution of pPKCι. p < 0.001 for both time points compared with negative control, Fisher's exact test in SigmaPlot (Systat Software Inc., San Jose, CA). C and D, the specificity of pPKCι (C) and total PKCι (D) immunofluorescent staining was tested by comparing signal obtained after treatment with luciferase (Luc, upper rows) versus PKCι (lower rows) siRNA as described in the Fig. 2 legend (Wnt3a was not used in this experiment). The cells were fixed in methanol. A scale bar is indicated. Ctl., control.
