
FIGURE 7.
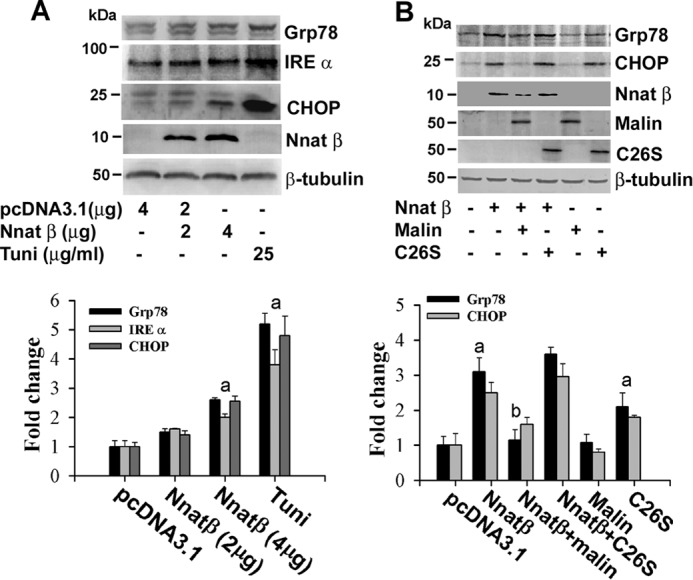
Neuronatin induces ER stress, which is suppressed by malin and enhanced by C26S mutant of malin. A, Neuro 2a cells were transfected with different concentrations of neuronatin plasmid for 48 h. Cells were treated with dbcAMP (5 mm) for 24 h before collection and then subjected to immunoblot analysis using various antibodies as indicated in the figure. Tunicamycin (Tuni, 25 μg/ml) was treated for 6 h. Band intensities of Grp78, IRE-α, and CHOP were quantified using NIH ImageJ analysis software, normalized against β-tubulin, and expressed as -fold change. B, cells were transfected with plasmid encoding neuronatin or malin independently or together for 48 h, treated with dbcAMP as in A, and then processed for immunoblotting using various antibodies shown in the figure. Grp78 and CHOP blots were quantified, normalized against β-tubulin, and expressed as -fold change. Values are mean ± S.D. of four different experiments. The a represents p < 0.05 compared with the respective empty pcDNA3.1-transfected group, and b represents p < 0.01 compared with neuronatin-transfected group.