
FIGURE 8.
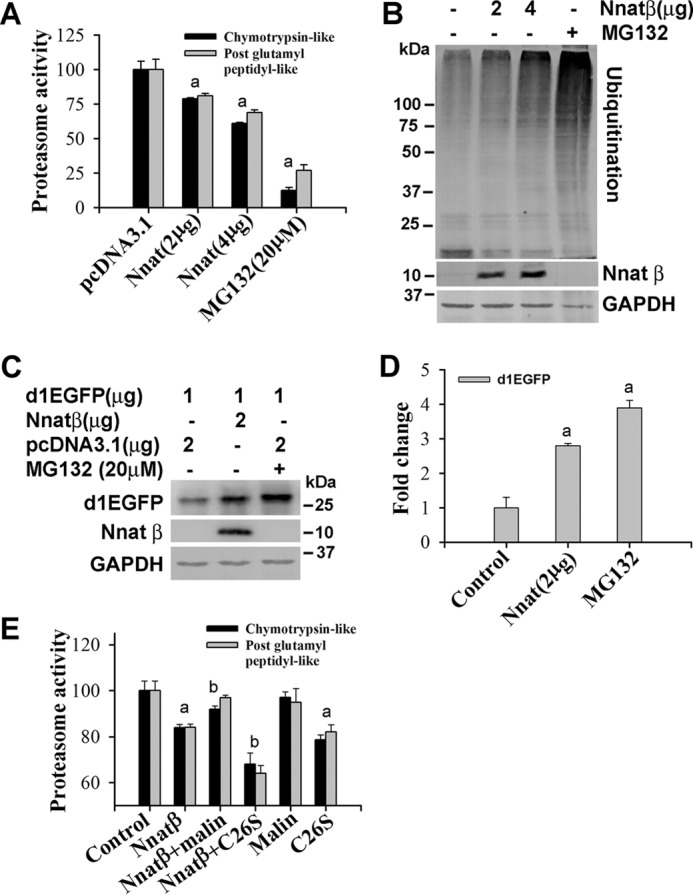
Neuronatin-induced proteasomal dysfunction is partially recovered by malin. A and B, Neuro 2a cells were transfected with different concentrations of plasmid encoding neuronatin and differentiated as described in Fig. 6A. Forty-eight hours after transfection, cells were either processed for proteasome activity assays (A) or immunoblot analysis using ubiquitin, myc (to detect neuronatin β) and GAPDH antibodies (B). Values are mean ± S.D. (error bars) of three independent experiments each performed in triplicate. The a indicates p < 0.01 compared with control. C, cells were transiently transfected with plasmid encoding pd1EGFP alone or along with neuronatin β for 48 h, and the collected cells were then processed for immunoblotting using antibody against GFP. D, the band intensities of d1EGFP from three independent experiments were quantified using NIH ImageJ analysis software. Proteasome inhibitor MG132 (20 μm for 6 h) was used as positive control. The a indicates p < 0.001 compared with control. E, cells were transfected with various plasmids and differentiated as described in Fig. 6D. Cells were collected and subjected to proteasome activity assay. Values are mean ± S.D. of three different experiments each performed in triplicate. The a indicates p < 0.01 compared with the empty pcDNA3.1-transfected group (control), and b represents p < 0.01 compared with the neuronatin-transfected group.