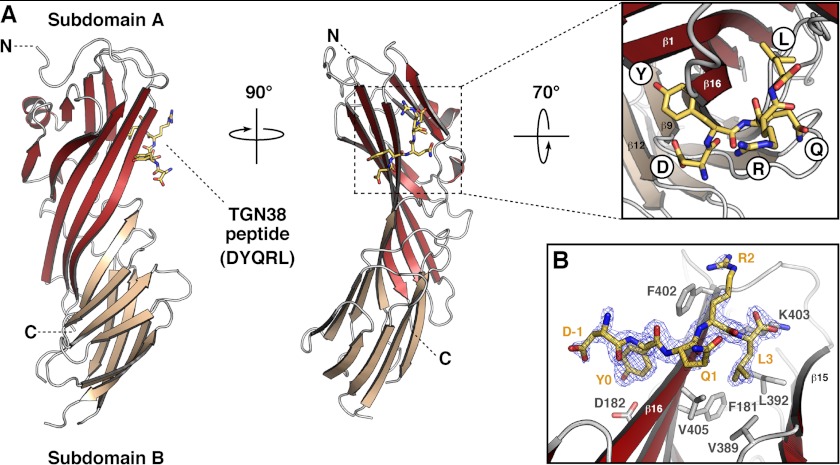
FIGURE 1.
Crystal structure of the μ3A C-terminal domain in complex with a YXXØ-encoding peptide from TGN38. A, ribbon representation of rat μ3A C-terminal domain with subdomain A in brick red, subdomain B in salmon, and the TGN38 peptide (DYQRL; stick model) in yellow. The inset shows the location of the peptide side chains on the binding site. The position of the N (N) and C (C) termini are indicated. B, stick representation of the bound peptide DYQRL (shown with carbon atoms colored yellow) superimposed on a 2Fo − Fc omit electron density map contoured at 1.5σ, and μ3A binding site amino acid residues are highlighted in stick representation (shown with carbon atoms colored gray).

