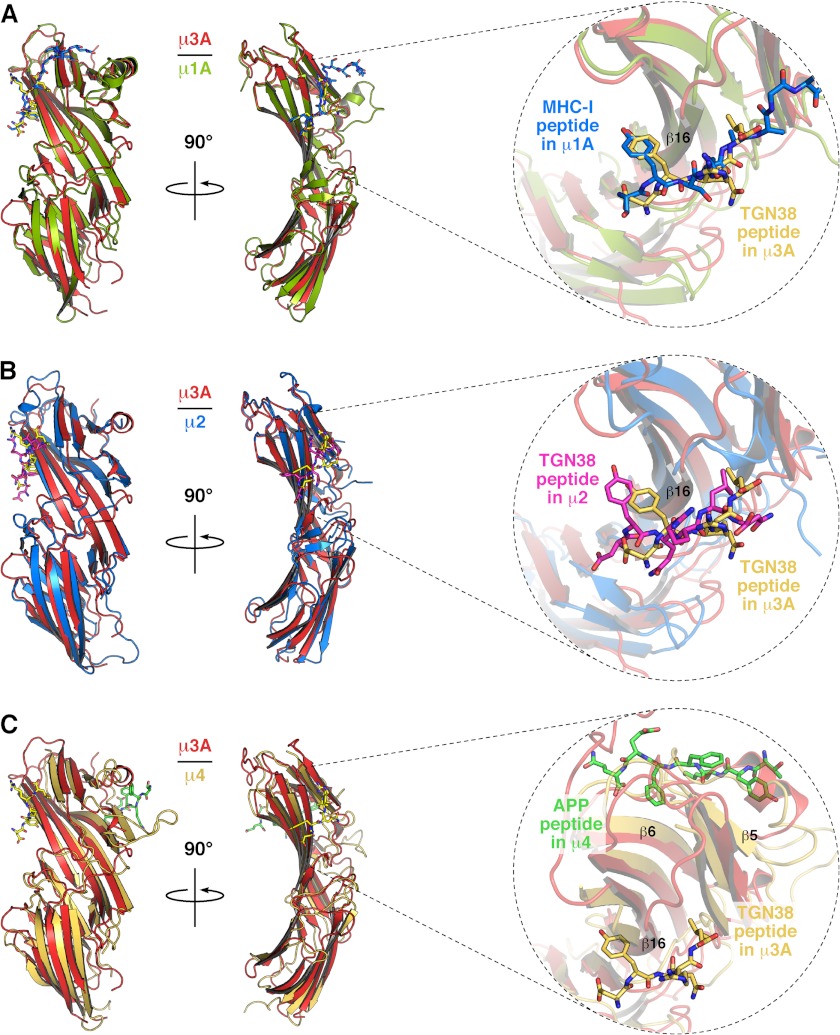
FIGURE 2.
Comparison of the crystal structure of μ subunits. A, superposition of rat μ3A (red) and mouse μ1A (green; PDB code 4EN2) (22). B, superposition of μ3A (red) and rat μ2 (blue; PDB code 1BXX) (20); and C, superposition of μ3A (red) and human μ4 (orange; PDB code 3L81 (21) shown in ribbon representation. The bound peptides SYSQAAGSDSAQ on μ1A (shown with carbon atoms colored blue; oxygen colored red; nitrogen colored blue), DYQRLN on μ2 (carbon atoms colored magenta), DYQRL on μ3A (carbon atoms colored yellow), and TYKFFEQ on μ4 (carbon atoms colored green) are shown in stick representation.

