Figure 2.
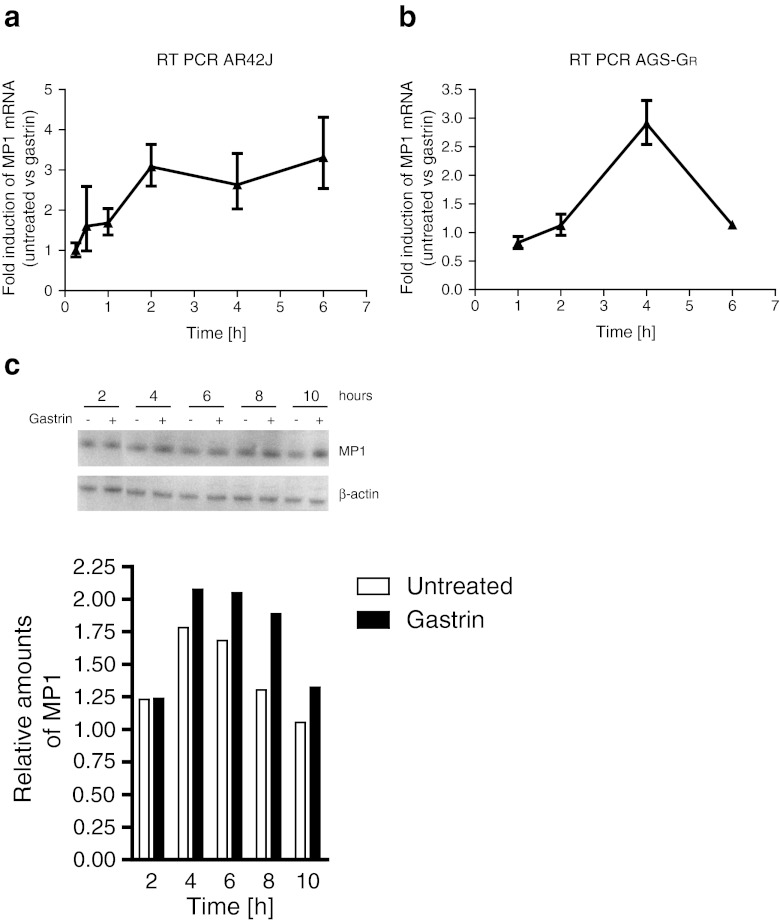
Gastrin-mediated activation of MP1 in AR42J and AGS-GR cells. (a) Verification of gene expression microarray results with quantitative RT-PCR in AR42J. Cells were seeded in 6-well plates and serum starved for 24 h the following day prior to treatment with gastrin (10 nM) as indicated in figure. (b) Quantitative RT-PCR analysis of MP1 expression in AGS-GR. Cells were seeded in 6-well plates and cultivated 24 h prior to gastrin treatment (10 nM) as indicated in figure. Fold induction levels were calculated using the ΔΔCt-method (Livak and Schmittgen 2001), where the expression levels were normalized to the level of β-actin (AR42J) or GAPDH (AGS-GR) expression, and gastrin-treated cells were compared to untreated cells. One representative experiment is shown and data presented as mean ± SD of three technical replicates. (c) Western blot of AGS-GR lysates from cells treated with 10 nM of gastrin 2–10 h before harvesting. The blot was treated with non-commercial antibodies against MP1, and β-actin was used as loading control. Lower panels show relative quantification of band intensities from western blot analysis.

