
Table 4.
Blood pressure and pulse rate difference between BNR17 and placebo groups
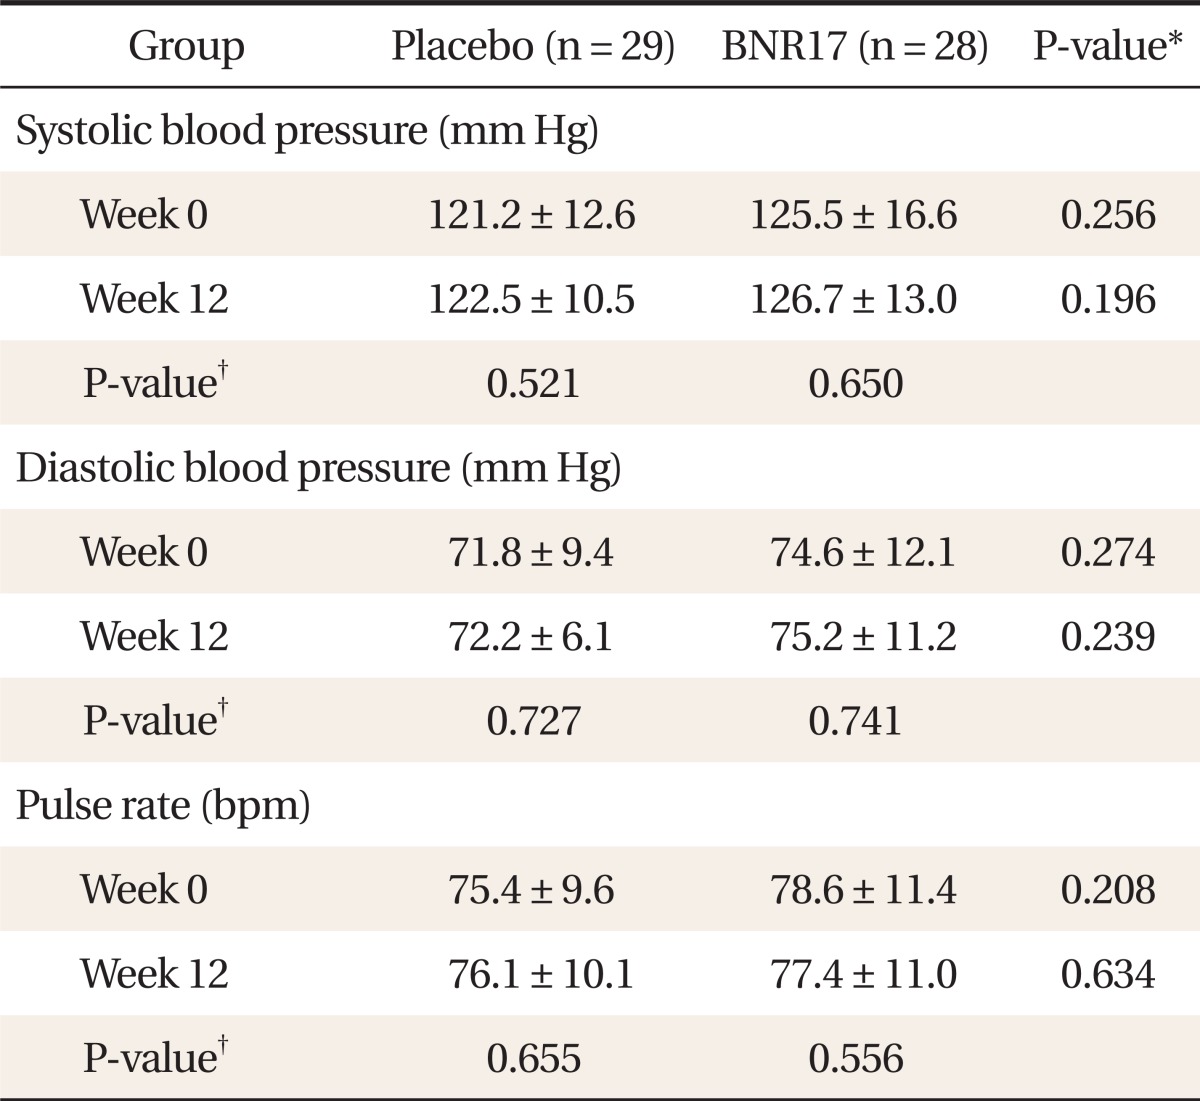
Values are presented as mean ± SD.
*t-test result for Placebo group and anti obesity microorganism group. †Paired t-test result for both groups at weeks 0 and 12.
Official websites use .gov
A
.gov website belongs to an official
government organization in the United States.
Secure .gov websites use HTTPS
A lock (
) or https:// means you've safely
connected to the .gov website. Share sensitive
information only on official, secure websites.
Blood pressure and pulse rate difference between BNR17 and placebo groups
Values are presented as mean ± SD.
*t-test result for Placebo group and anti obesity microorganism group. †Paired t-test result for both groups at weeks 0 and 12.