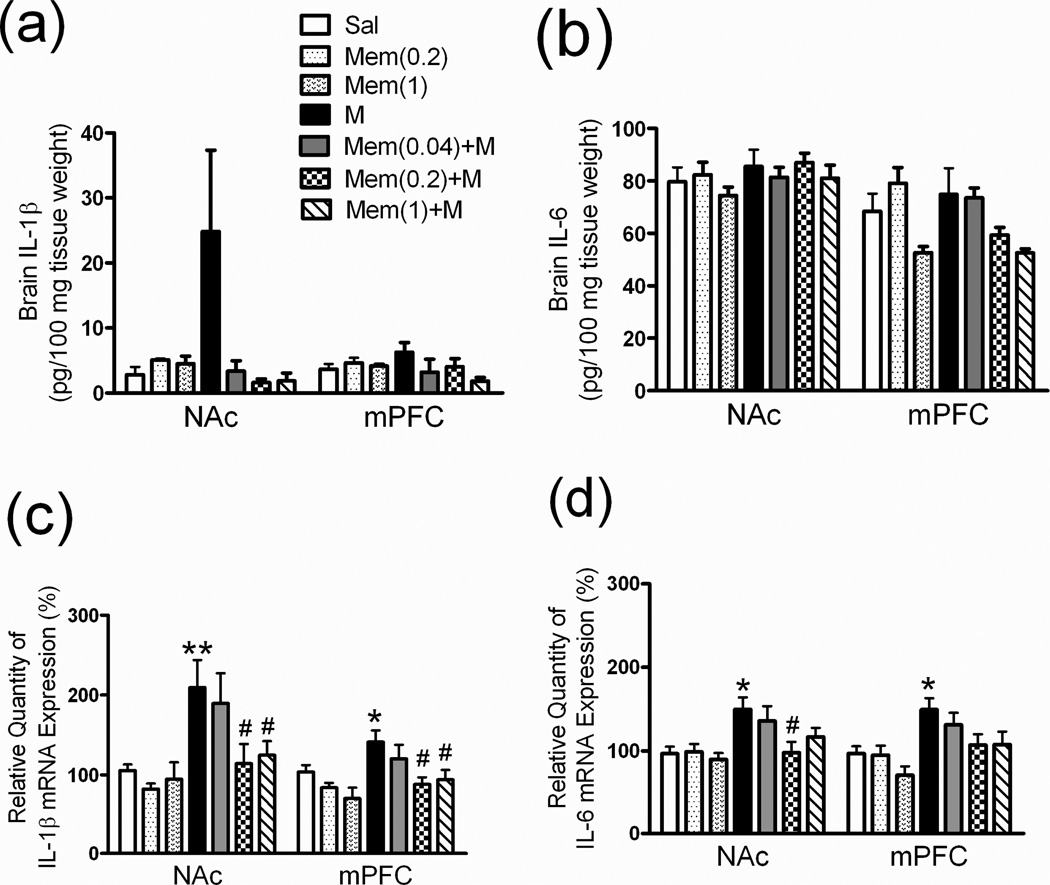
Fig 4. Brain cytokine (IL-1β, IL-6) and mRNA expression profiles in rats.
See Figure 2 legend for groups and treatments. The (a) IL-1β and (b) IL-16 levels in two addiction-related brain areas (NAc: nucleus accumbens, mPFC: medial prefrontal cortex). The (c) IL-1β mRNA and (d) IL-6 mRNA expression levels in the NAc and mPFC mRNA expression was measured using quantitative polymerase chain reaction (QPCR) analysis and calculated as the relative quantity change percentage (%)compared with the saline group. Data are means ± S.E.M. *p < 0.05, **p < 0.01 vs. Sal group. #p < 0.05 vs. M group (one-way ANOVA).

