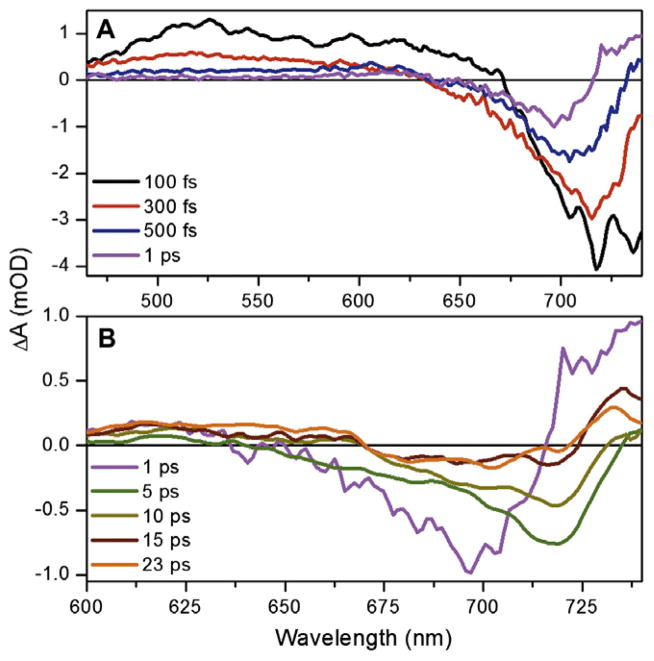
Figure 2.
Transient spectra of Cph1 reverse reaction in (A) sub-picosecond, and (B) post-picosecond regimes. The 5, 10, 15, and 23-ps spectra in panel B are smoothed for visual inspection due to low signal amplitude. The 460–600 nm spectral range is not shown in panel B to emphasize the low-energy dynamics.

