
Figure 4.
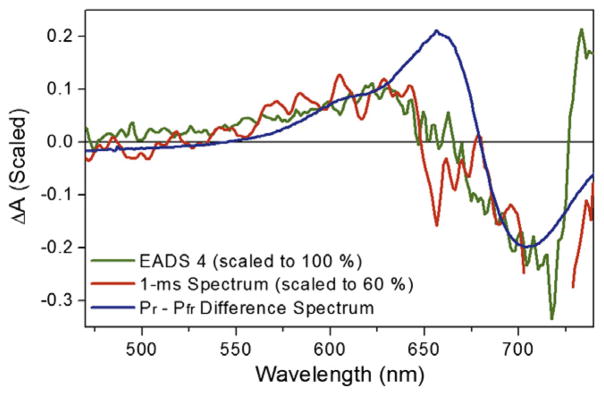
The 1-ms transient difference spectrum (red curve) is compared with EADS4 (green curve) and the Pr–Pfr difference spectrum (blue curve). The 1-ms spectrum is scaled to 60% to match the EADS4 amplitude. (For interpretation of the references to color in this figure legend, the reader is referred to the web version of this article.)