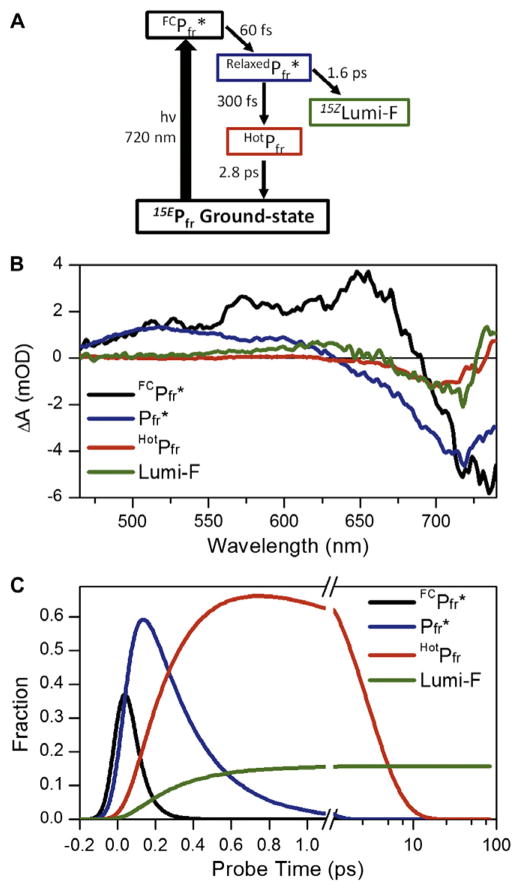
Figure 6.
(A) Target model of the Cph1 reverse reaction indicating four different spectral components and the reaction pathway with associated time constants. (B) Species-Associated-Difference-Spectra (SADS) of the target model. (C) The concentration profile of each transient population in the model, color coded to Panel B. The E-to-Z isomerization quantum yield (Φ) is fixed at 16% in the model.

