
Figure 7.
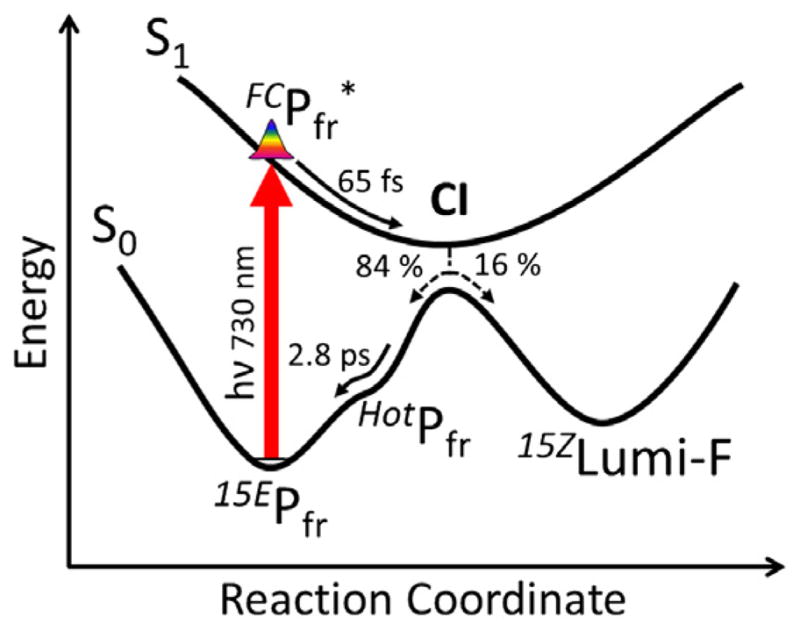
A model potential energy surface diagram representing the Cph1 reverse reaction dynamics in agreement with the target model analysis in Figure 6.
Official websites use .gov
A
.gov website belongs to an official
government organization in the United States.
Secure .gov websites use HTTPS
A lock (
) or https:// means you've safely
connected to the .gov website. Share sensitive
information only on official, secure websites.
A model potential energy surface diagram representing the Cph1 reverse reaction dynamics in agreement with the target model analysis in Figure 6.