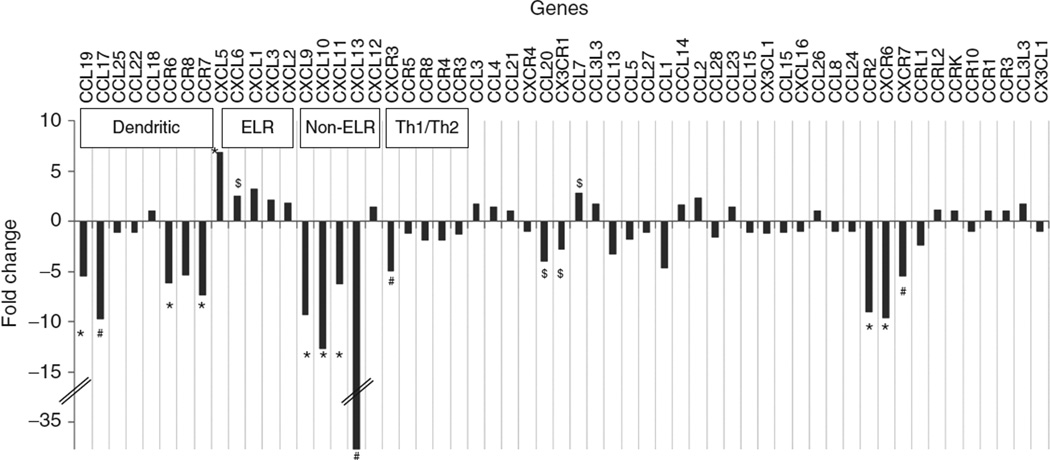
Figure 4.
Chemokine gene expression in obese and lean subjects. Differential expression of chemokines is quantified by the fold-change in gene-expression signals in obese compared to lean subjects (from microarray). Chemokines are classified as described in the text. The symbols indicate the level of statistical significance for differential expression ($P < 0.05; #P < 0.01; *P < 0.005). The fold-change axis (y axis) is truncated to accommodate a large range of fold-change values.

