
Fig. 12.
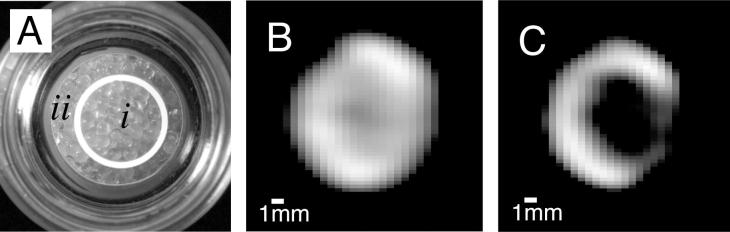
(A) Photograph of a sample containing 1.0 mm glass beads with a siliconized, hydrophobic surface in compartment (i) and an untreated, hydrophilic surface in compartment (ii). (B) MRI of gas phase hp 83Kr shortly after transfer into the sample. (C) Hp 83Kr MRI as in (B) but after additional 6 s delay time, showing a surface sensitive MRI contrast. The 83Kr quadrupolar relaxation caused by surface interactions leads to T1 = 9 s in the hydrophobic region (i) and to T1 = 35 s in the hydrophilic region (ii). Adapted figure, printed with permission from Pavlovskaya et al. P. Ntl. Acad. Sci. USA 2005; 102:18278 © 2005 National Academy of Sciences, USA.