
Figure 5.
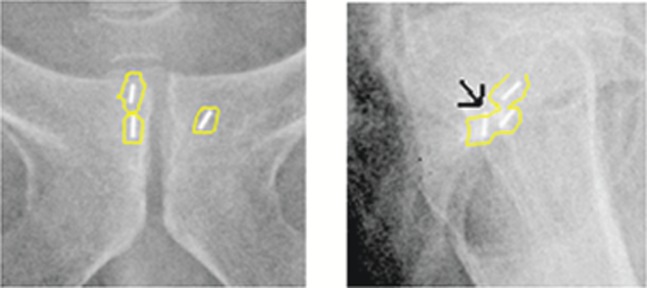
Anteroposterior and lateral kilovoltage images showing a matching process in an example with seed migration of 2.5 mm (arrow). The superior edge of the posterior seed overlaps with the seed structure outline based on the CT planning scan.
Official websites use .gov
A
.gov website belongs to an official
government organization in the United States.
Secure .gov websites use HTTPS
A lock (
) or https:// means you've safely
connected to the .gov website. Share sensitive
information only on official, secure websites.
Anteroposterior and lateral kilovoltage images showing a matching process in an example with seed migration of 2.5 mm (arrow). The superior edge of the posterior seed overlaps with the seed structure outline based on the CT planning scan.