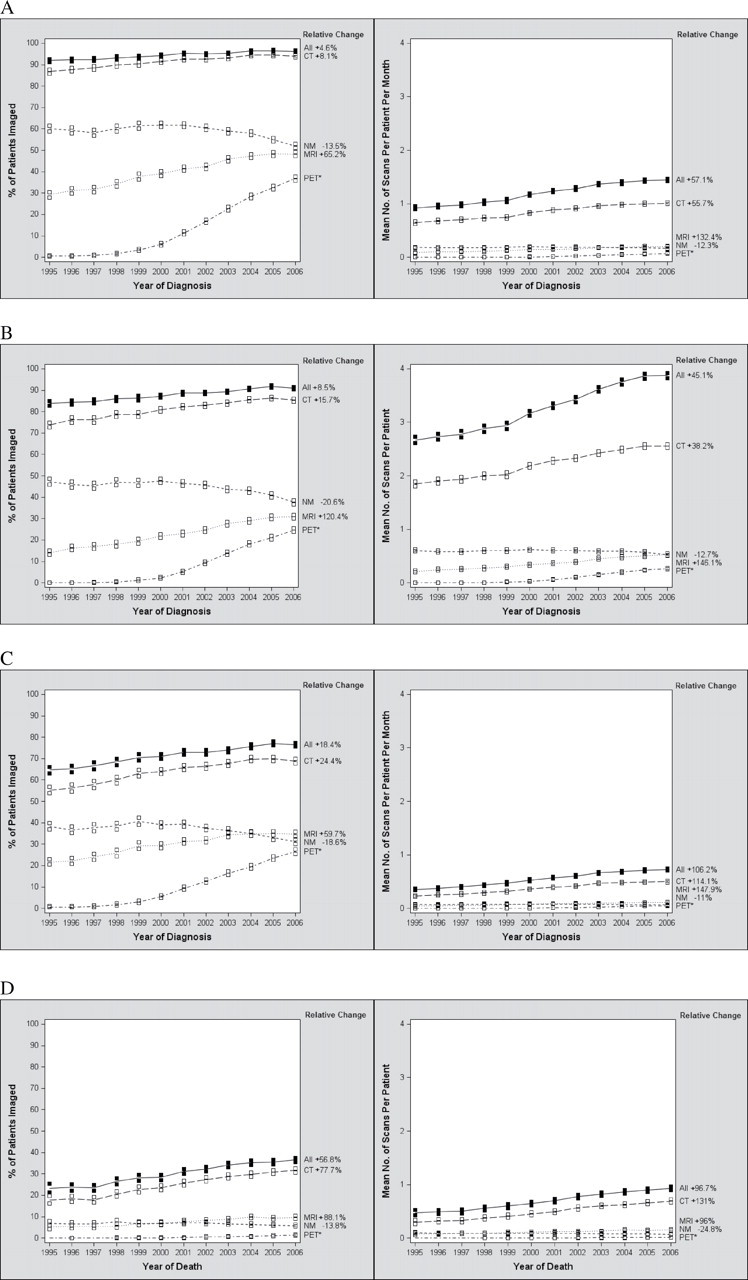
Figure 2.

Time trends (1995–2006) in high-cost imaging modalities in stage IV cancer patients. Relative changes (%) in high-cost imaging procedures (CT, MRI, PET, or NM) between January 1995 and December 2006 are shown on the right side of each graph. Each row represents a different phase of care. A) All phases of care. B) Diagnostic phase. C) Continuing care phase. D) Last month of life. For (A), (B), (C), and (D), the left panels show the time trends in the proportion of patients imaged, analyzed using logistic regression method, and the right panels show the time trends in the number of procedures per patient, analyzed using robust linear regression method. Boxes represent 95% confidence intervals for use in each year. For analyses of the diagnostic and continuing care phases (A, B, and C), patients were classified based on year of diagnosis. For analyses of the last month of life (D), patients were classified based on year of death. In (A) and (C), the mean number of scans per patient is normalized per month of survival. Within each cohort, all two-sided P values for time trends from 1995 to 2006 were statistically significant (P trend < .001). CT = computed tomography; MRI = magnetic resonance imaging; PET = positron emission tomography; NM = nuclear medicine; + = relative increase; − = relative decrease. *No relative increase is presented for PET scans given that the utilization rate approached 0 at the beginning of the study period.
