
Figure 5.
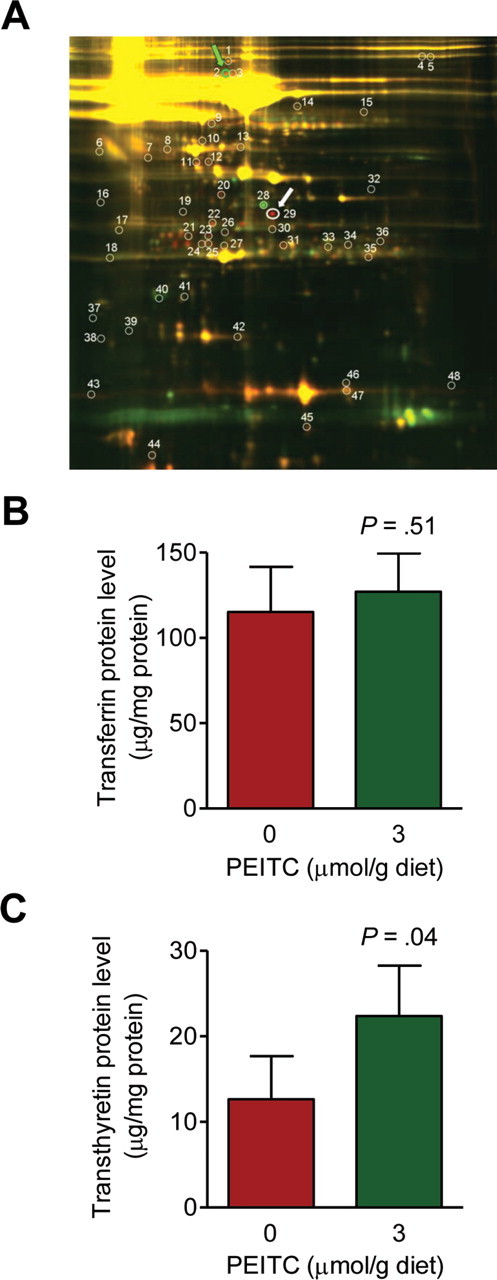
Effect of phenethyl isothiocyanate (PEITC) administration on transferrin and transthyretin protein levels in the plasma of mouse mammary tumor virus–neu mice. A) Fluorescence images of two-dimensional gel electrophoresis overlays depicting differences in protein expression between plasma samples from representative mice placed on the control diet vs the PEITC-supplemented diet. Protein spots for transferrin and transthyretin are identified by green and white arrows, respectively. B) Levels of transferrin in the plasma of mice placed on the control diet vs the PEITC-supplemented diet. Results shown are mean plasma transferrin levels (µg/mg protein) with 95% confidence intervals (error bars) (n = 5 mice per group). C) Levels of transthyretin in the plasma of mice placed on the control diet vs the PEITC-supplemented diet. Results shown are mean plasma transthyretin levels (µg/mg protein) with their 95% confidence intervals (error bars) (n = 5 mice per group). Statistical significance of differences in panels B and C was determined by two-sided Student’s t tests.