
Figure 1.
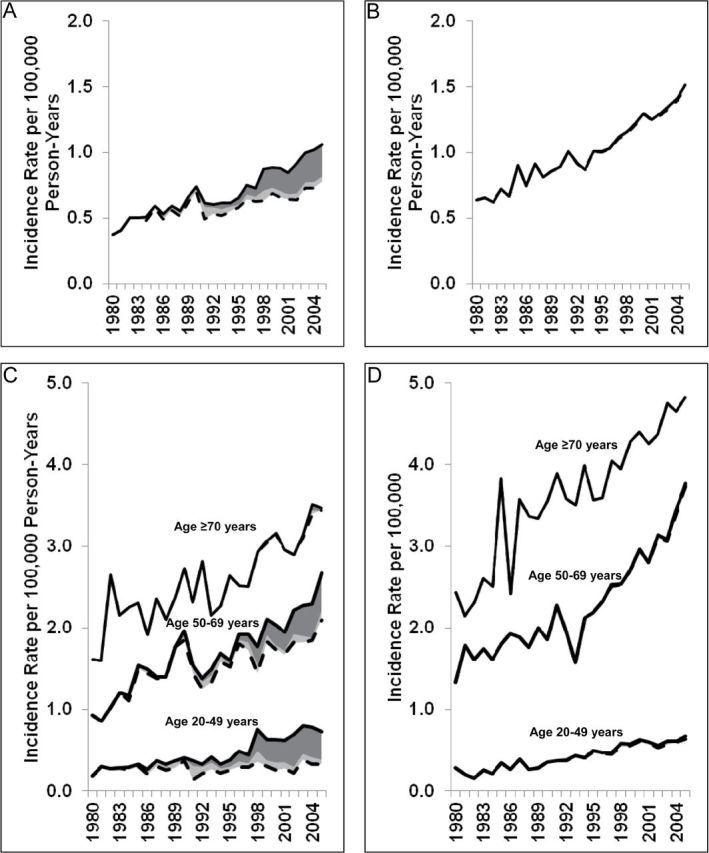
Anal cancer incidence in the general population with and without HIV-infected anal cancer cases, by age and sex, between 1980 and 2005. The solid lines represent the overall incidence rates of anal cancers in the general population; the dashed lines represent the incidence rates for anal cancers without HIV-infected anal cancer cases; the dark gray shaded areas represent anal cancer cases with AIDS, and the light gray shaded areas represent anal cancer cases with HIV-only. A) Incidence rates in males. B) Incidence rates in females. C) Incidence rates in males, stratified by age group. D) Incidence rates in females, stratified by age group.