Figure 1.

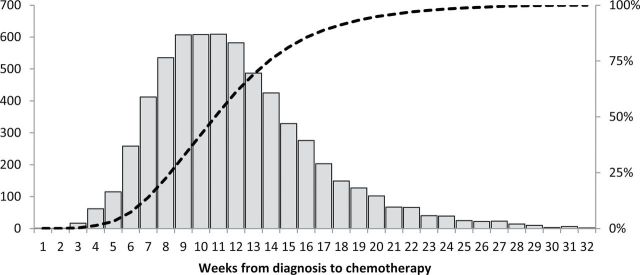
Distribution of weeks from diagnosis to chemotherapy. Bars refer to patient numbers on the y axis on the left. The dashed line refers to the cumulative percentage of all patients on the y axis on the right.

Distribution of weeks from diagnosis to chemotherapy. Bars refer to patient numbers on the y axis on the left. The dashed line refers to the cumulative percentage of all patients on the y axis on the right.