Figure 2.

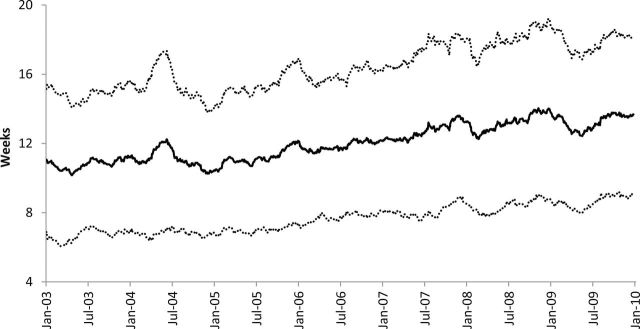
Weeks from diagnosis to chemotherapy by date of presentation to the National Comprehensive Cancer Network center. The solid black line refers to the 90-day simple moving average (SMA). Dashed lines refer to the SMA +/– 1 SD.

Weeks from diagnosis to chemotherapy by date of presentation to the National Comprehensive Cancer Network center. The solid black line refers to the 90-day simple moving average (SMA). Dashed lines refer to the SMA +/– 1 SD.