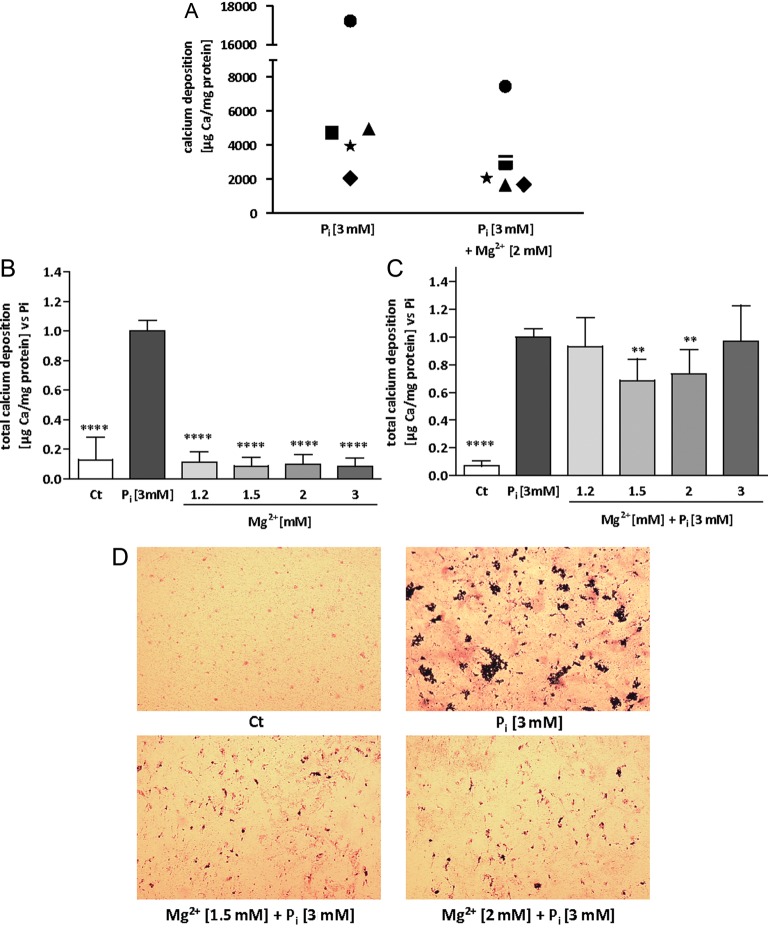
FIGURE 1:
Magnesium reduces Pi-induced mineral deposition in HAVSMC. HAVSMC were cultured for 14 days at the indicated concentrations of Mg2+ and in the presence or absence of 3 mM Pi. (A) Calcium deposition from HAVSMC of five different donors was assessed using OCP. Filled square, filled circle, star, filled triangle and filled diamond represent means of the Ca2+ content of each of the five donors for each indicated condition. (B) Calcium deposition from HAVSMC of three different donors was assessed using OCP with increasing concentration of Mg2+ without induction of Pi. Data are quoted as a ratio of Pi and represent the mean ± SD of each condition (n = 6). Ct was significantly different from Pi, ****P < 0.0001 versus Pi. No significant differences were found between Ct and Mg2+ conditions. (C) Calcium deposition from HAVSMC of three different donors was assessed using OCP with increasing concentration of Mg2+ and induction of calcification by Pi. Data are represented as a ratio of Pi and represent the mean ± SD of each condition (n = 6). Ct was significantly different from Pi. **P < 0.01 versus Pi and ****P < 0.0001 versus Pi. (D) Von Kossa followed by a haematoxylin/Mayer counterstaining was performed on the cell layer; nuclei are depicted in red while granulated calcifications are coloured in black (×25 magnification).

