Figure 4.
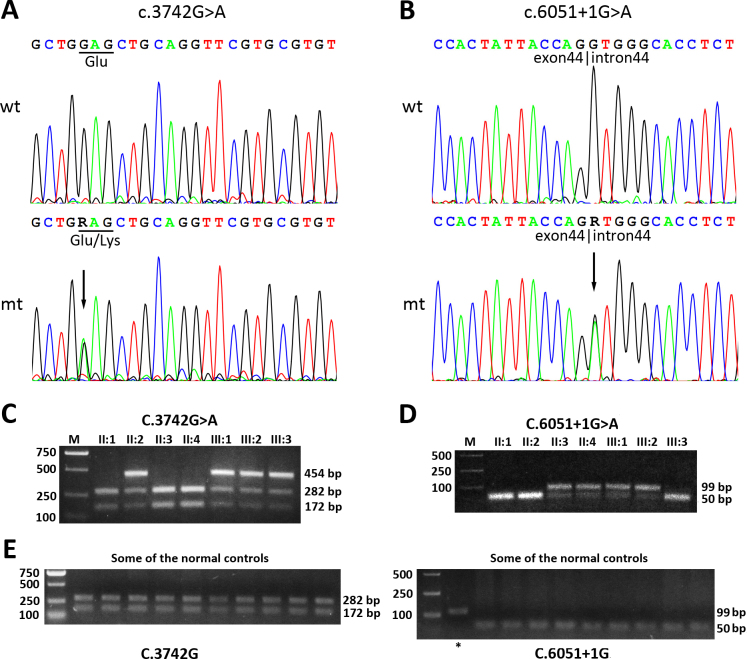
Identification of the two novel MYO7A mutations and their cosegregation with the disorder in the family. A: DNA sequencing profiles for regions around position C.3742. The upper panel represents the sequencing result of wild-type (wt) from individual II1. The lower panel represents the sequencing result of mutant (mt) from individual III1. The mutation c.3742G>A is indicated with an arrow on the mt trace. The affected codon is marked with an underline. B: DNA sequencing profiles for regions around position c.6051+1. The mutation c.6051+1G>A is indicated with an arrow on the mt trace. The exon-intron boundary is labeled. C: Representative restriction fragment length polymorphism (RFLP) analysis for position c.3742. For normal individuals II1, II3, and II4, restriction by BstXI resulted in two bands, while for individuals II2, III1, and III3, restriction by BstXI resulted in three bands, suggesting the presence of a mutation in the polymerase chain reaction (PCR) product. D: Representative RFLP analysis for position c.6051+1. For normal individuals II1, II2, and III3, restrictive digested by ScrFI resulted in just one mixed band with fragments 41 bp and 48 bp, while for individuals II3, II4, III1, and III2, digested by ScrFI resulted in two bands, suggesting the presence of a mutation in the PCR product. E: RFLP analysis for the two mutations in 100 normal controls out of the family. Only one representative image for each mutation (left panel for position c.3742G, right panel for position c.6051+1G) was selected to be shown in the paper. The asterisk in the right panel indicates the PCR product without adding the restriction endonuclease ScrFI, which serves as a control.

