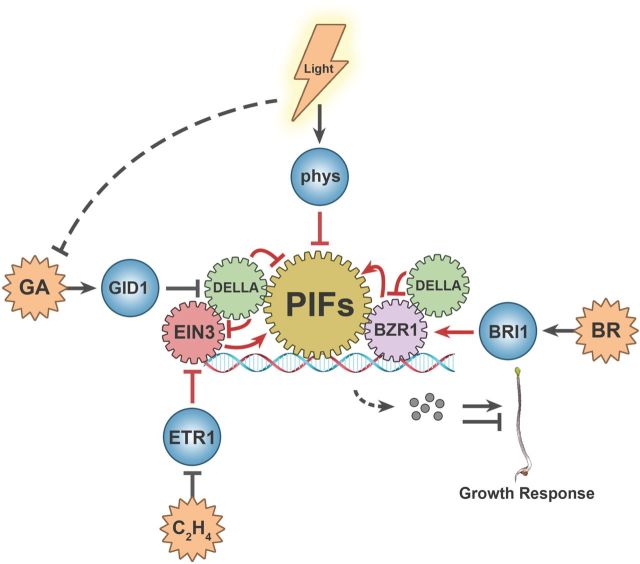
Figure 1.
A Simplified View of the Interactive Signaling Network of Phytochromes and Phytohormones. The multiple-pointed stars (orange) represent hormonal signals, spheres (blue) represent receptors, and gears represent signal-responsive transcription regulators associated with growth regulation. The arrows and bars represent stimulatory or inhibitory effect, respectively.

