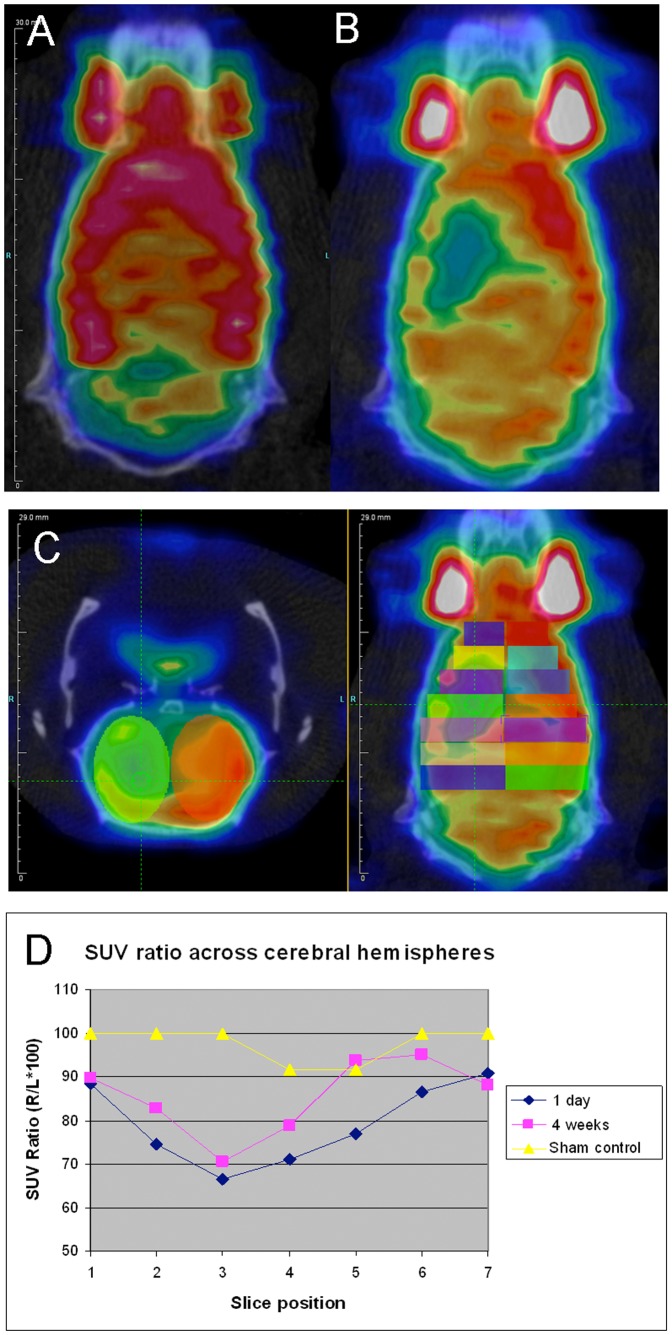
Figure 1. Analysis of infarct severity and extent on PET/CT imaging in representative sham and MCAO brains.
A. Coronal view of a sham-operated animal showing normal symmetrical glucose uptake. B. One day post-MCAO, there is decreased uptake on the side of the infarct. C. Axial and coronal images showing placement of 2 mm thick ovoid regions of interest (ROIs) [symmetrical across the midline, arbitrary colors] across the cerebral hemispheres. D. Mean standardized uptake value (SUV) ratios (infarcted to contralateral side ROI) are plotted against slice position comparing infarcted and sham-operated control rat shown in A–C. The severity of the infarct is reflected both by the number of slices affected, and the degree to which activity is suppressed (relative to normal) in each slice. Over 4 weeks, there was a modest spontaneous improvement in FDG uptake, which correlated with the improvement seen in mNSS scores from 6 to 4 (not shown). Imaging was repeated for 3 sham-lesioned and 3 MCAO lesioned rats.

