
Figure 4. Alkaline phosphatase labeled rBMSCs in vitro and after IV administration into MCAO rats.
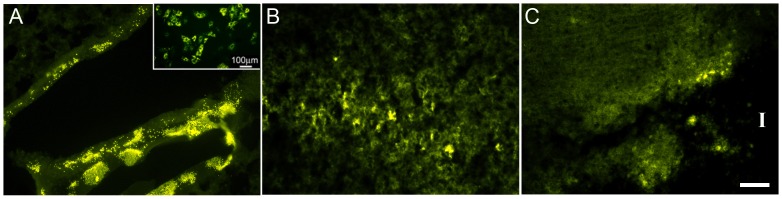
Panel A.: Lung sections 3 days after transplantation; BMSCs show intense activity in the small airways. Note distinct green punctate Alk Phos histochemical staining. Inset: Human alk phos in BMSCs in culture. B. Brain sections from the same animal showing activity in the peri-infarcted tissue. C. Brain at 8 days after transplantation shows some activity at the edge of the infarct zone (“I” = infarct, with no intact tissue). (N = 3) Scale bars in A,C = 100 um; B = 50 um.