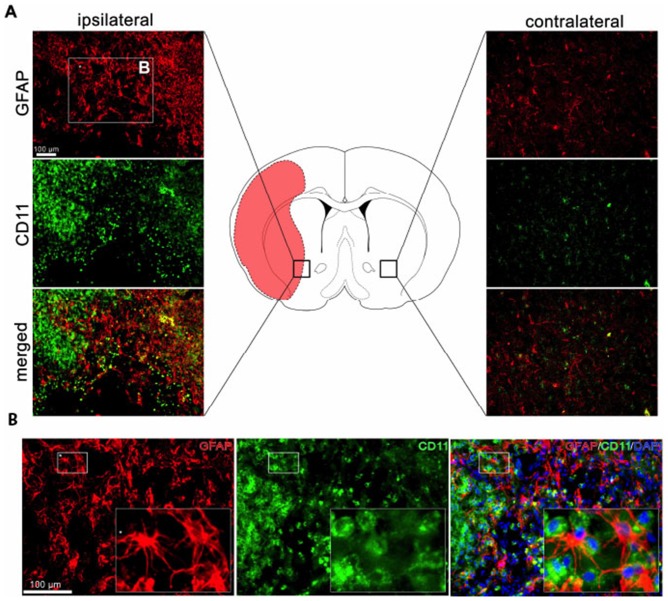
Figure 6. Immunocytochemical analysis of reactive glia and activated microglia in the region of the infarct 4 weeks after BMSC treatment in MCAO rats.
Panel A. Representative section through the brain of MCAO rat (center) showing area of infarction (red). Area in rectangle on ipsilateral (left) or contralateral (right) sides of MCAO shown enlarged after staining with GFAP (reactive astrocytes) and CD11 (activated microglia) or merged images in side panels. Panel B. Area labeled “B” in rectangle of Panel A is shown at higher power after staining for GFAP or CD11; Insets: magnified small rectangles of B. Bars in A and B = 100 µm. (N = 4).

