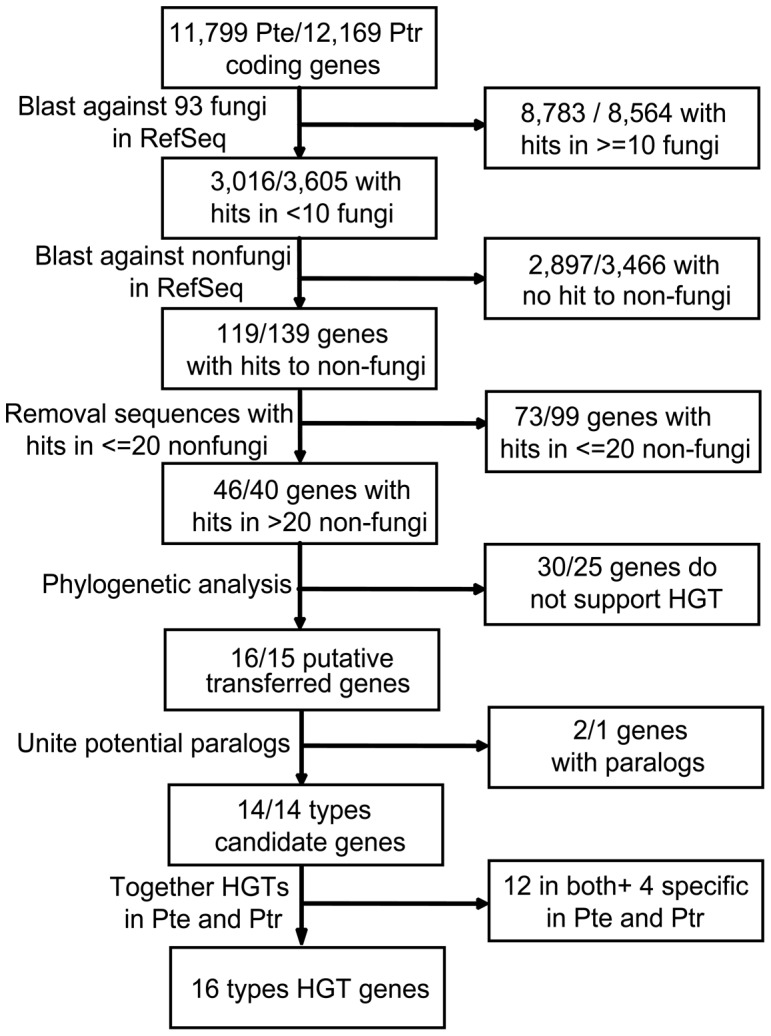
Figure 1. Flow chart of the screening methods used to detect the horizontally transferred genes and the results of each step.

Pte represents Pyrenophora teres and Ptr represents Pyrenophora tritici-repentis.

Pte represents Pyrenophora teres and Ptr represents Pyrenophora tritici-repentis.