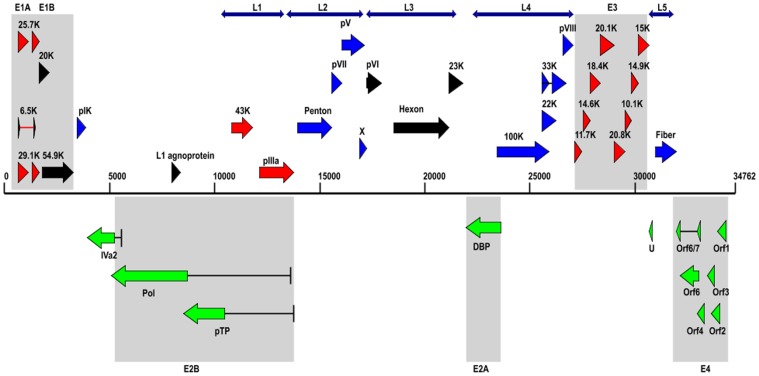
Figure 1. Genome organization of HAdV-B14p1 coding sequences.
The genome is represented by a central black horizontal line marked at 5-kbp intervals. Protein encoding regions are shown as arrows indicating transcriptional orientation. Forward arrows (above the horizontal black line) show coding regions in the 5’ to 3’ direction and arrows pointing to the left (below the horizontal black line) show the coding regions encoded on the complementary strand. Spliced regions are indicated by a black line joining the coding sequences. Colors are added for contrast between the groups and not indicative of other relationships other than grouping the genes to their transcript, for example, the two red genes of “L1” have no relationships to the eight red genes of “E3”.

