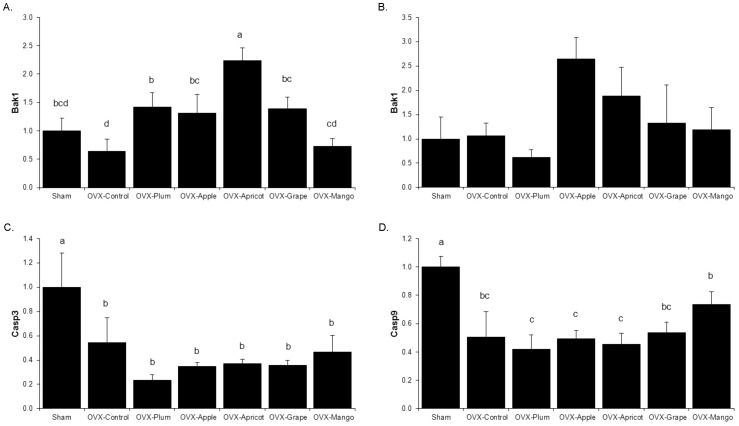
Figure 5. Relative mRNA Abundance of Apoptotic Genes.
The relative mRNA abundance of apoptotic genes was assessed in the bone marrow (A) and flushed femur (B–D). Genes of interest including, B-cell lymphoma homologous antagonist/killer (Bak1), caspase -3 (Casp3) and -9 (Casp9) from sham-operated (Sham) and ovariectomized (OVX) mice fed control diet, or control diet supplemented with either 25% (w/w) dried plum, apple, apricot, grape, or mango. Bars represent the mean ± SE, n = 6 mice in each group. Bars that share the same superscript letter are not significantly different from each other (p<0.05).

