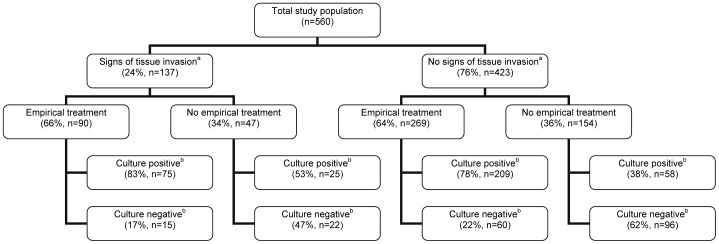
Figure 1. Patient population flow diagram based on signs of tissue invasion, empirical therapy and culture result.
The denominator of the given percentage per box was derived from the number given in the box one level up.aConsisted of fever (>38°C) and flank pain.bBased on the presence of ≥103 cfu/mL uropathogens on the urine dipslide.

