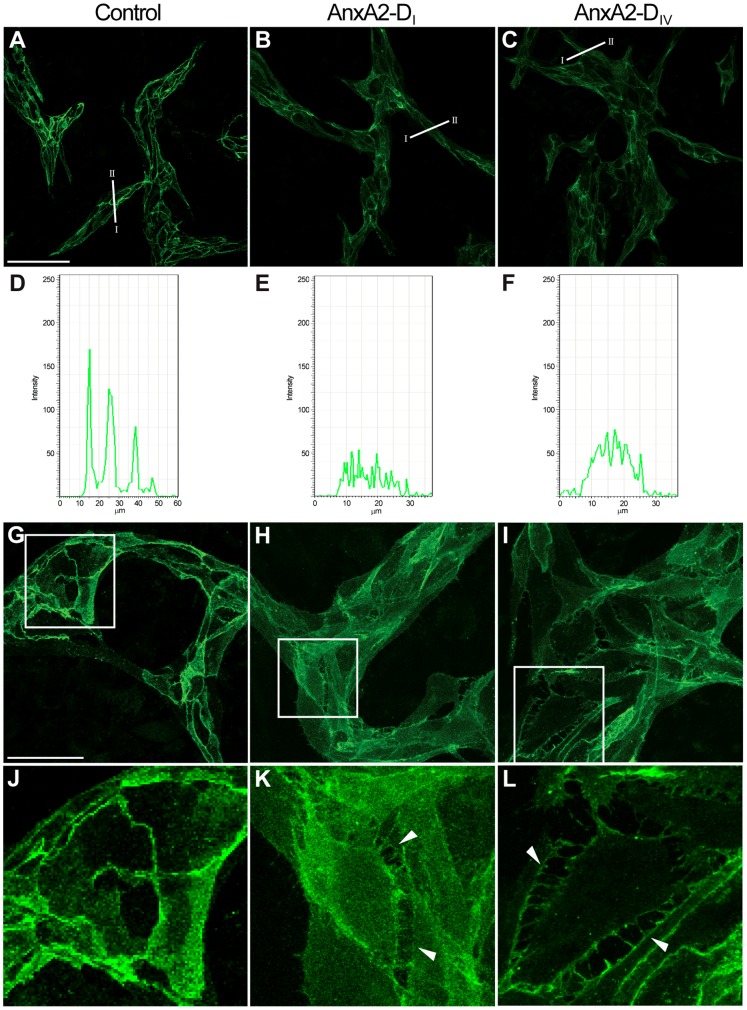
Figure 9. AnxA2-DI and AnxA2-DIV disrupt in vitro preformed capillary-like networks.
Co-cultures with a preformed EC network were untreated (A, D, G and J), or treated for 3 h with 15 µM AnxA2-DI (B, E, H and K) or AnxA2-DIV (C, F, I and L). The cells were fixed in 3% paraformaldehyde and permeabilised with 0.05% Triton X-100 in PBS before processing for immunofluorescence using antibodies against endogenous AnxA2 (BD Biosciences). Note the filopodia-like structures (arrowheads) particularly in Panels K and L. Inserts in Panels G, H and I are magnified and shown in Panels J, K and L, respectively. Graphical representation (D–F) of the fluorescence intensity profiles determined for cross-sections of the cell as indicated in A–C. The orientation of the sections (from I to II) corresponds to intensity profiles from left to right in D, E and F. Bars, 100 µm (A–C) or 50 µm (G–I).

