
Figure 1. Expression of Tmt within the gastric oxyntic mucosa and submucosa of HDC/Tmt mice.
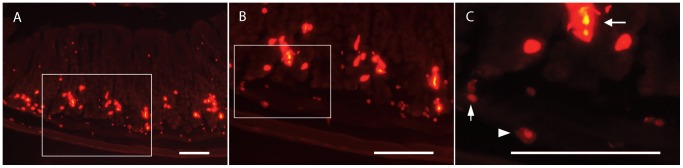
A) Low magnification photomicrograph showing expression of cells with different intensities of Tmt fluorescence in the gastric mucosa, submucosa, and muscularis layers. B–C) High magnification of same section reveals distinct shapes of different cell types: leftward-facing arrow points to a representative intensely-fluorescent, elongated cell (ECL cell); rightward-facing arrowhead points to a representative weakly-fluorescent, oval-shaped cell with a “fried egg” appearance (mast cell); upward-facing arrow points to a tiny, weakly-fluorescent round cell. Scale bar is 100 µm in all panels.