
Figure 4. Fluorescence activated cell sorting of gastric mucosal cells.
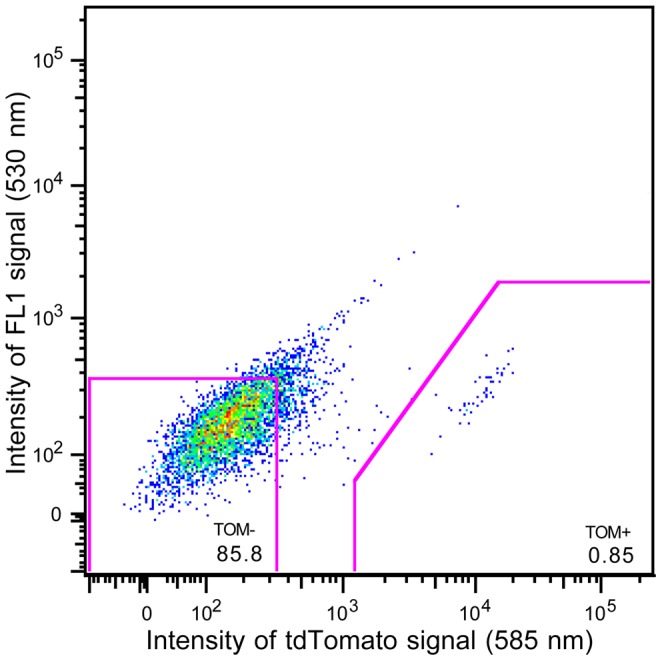
Graphical representation of FACS of mucosal cells from one representative set of HDC/Tmt mice, indicating cells collected as part of the Tmt-enriched pool (0.85% of the total number of sorted, living cells) and those collected as part of the Tmt-negative pool (85.8% of the total number of sorted, living cells).