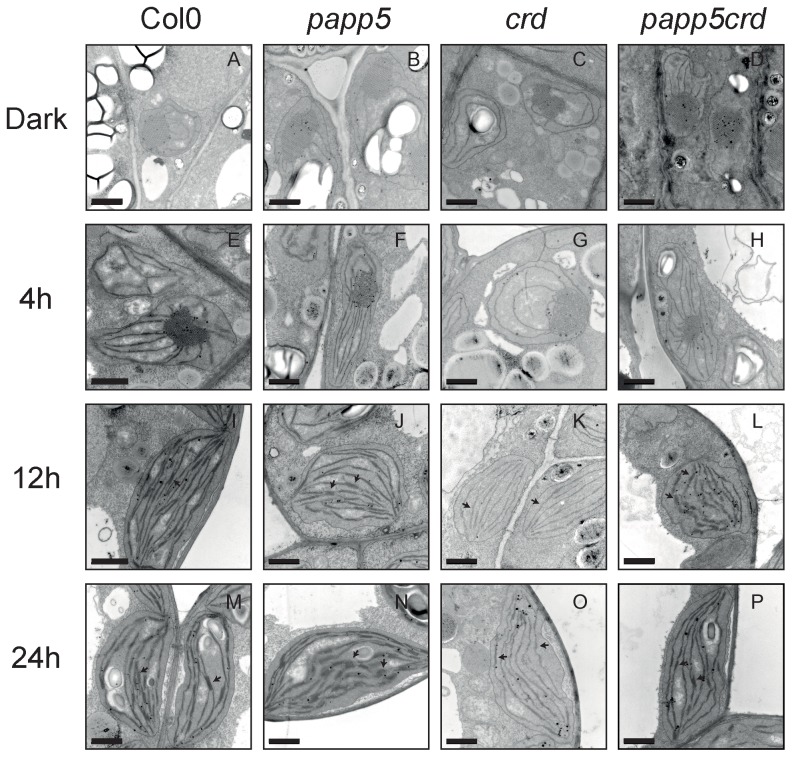
Figure 2. Chloroplast development during de-etiolation.
Sequential electron microscopy images from Col0 (A, E, I and M), papp5 (B, F, J and N), crd (C, G, K and O) and papp5crd (D, H, L and P) during the first 24 hours of illumination (100 µmol photons m−2 sec−1). Samples were collected 4 h, 8 h, 12 h and 24 h following transfer to light and compared to the dark sample. Arrows indicate examples of grana structures. Scale bar = 1 µm.

