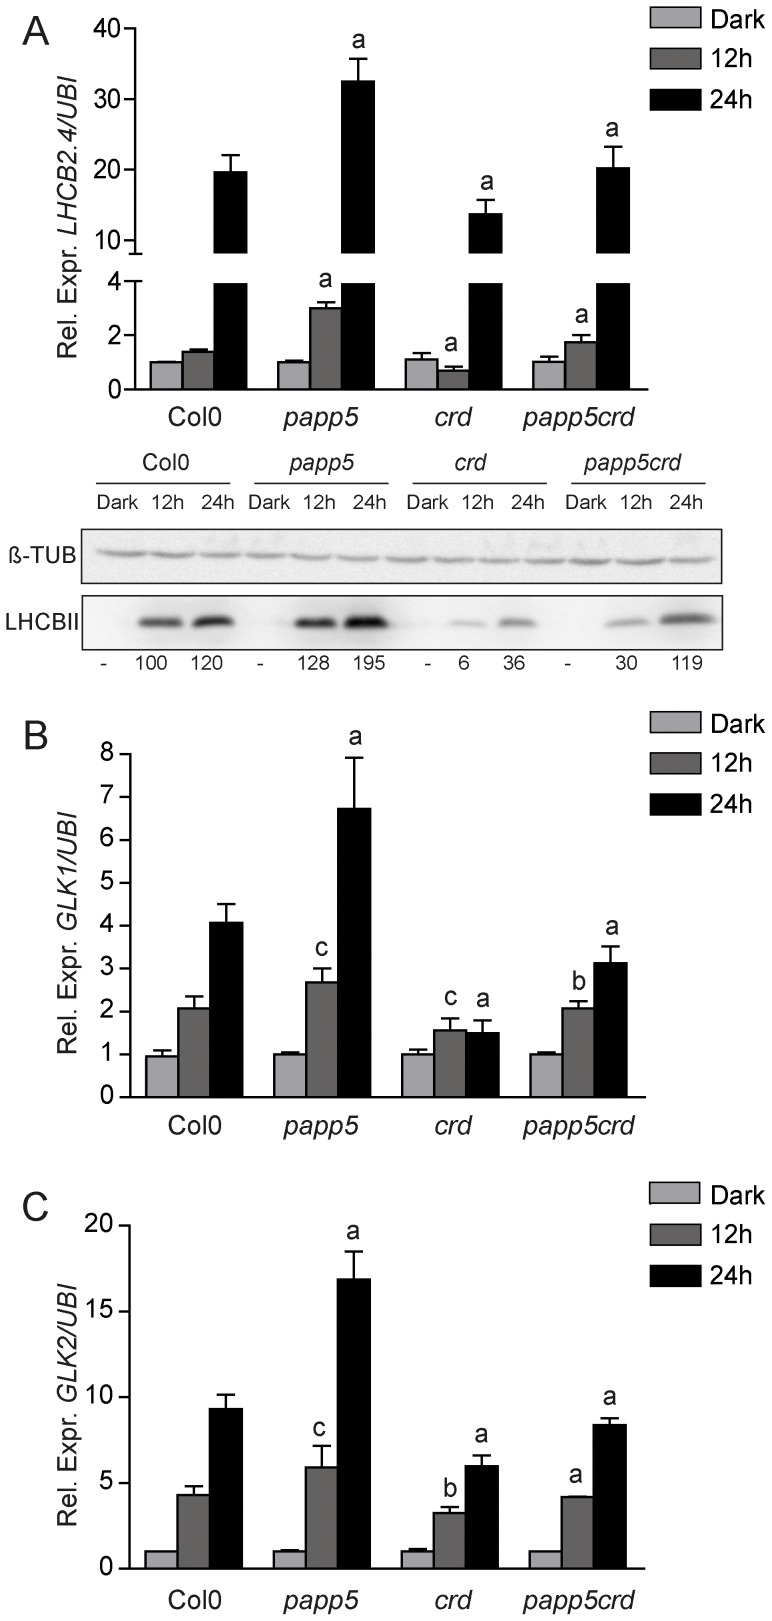
Figure 4. PhANG expression during chloroplast development.
Relative expression levels of A) LHCB2.4 (At3g27690) complemented with Western blot analysis of LHCBII protein and β-Tubulin as protein loading control, B) GLK1 (At2g20570) and C) GLK2 (At5g44190) in seedlings grown for three days in dark and exposed to 12 h and 24 h of illumination. Expression levels were compared to the respective dark control for each genotype and relative expression was calculated using Ubiquitin-protein ligase (At4g36800) as a reference gene. Data represents the mean (± SD) from three independent biological replicates. Significant differences relative to Col0 (crd and papp5) and to crd (papp5crd) were calculated according to t-test (a, P≤0.001; b, P≤0.005; c, P≤0.01). The bands were quantified using ImageJ software and the relative band intensities were obtained and related to Col0 12 h samples.

