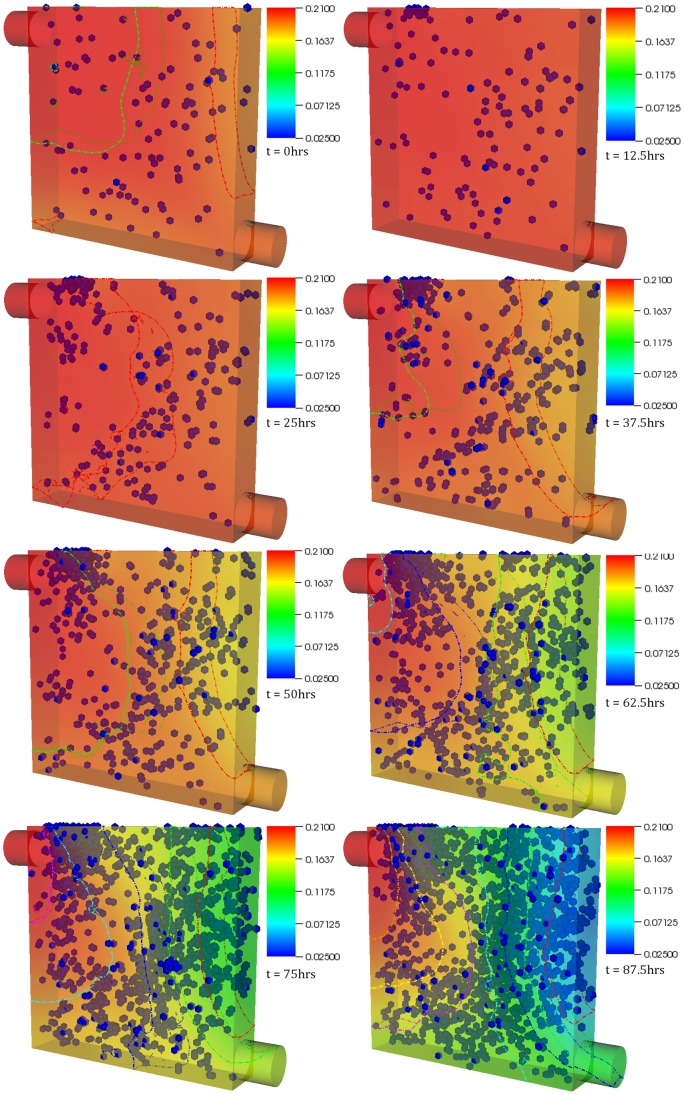
Figure 3. Case 2 results.
Temporal evolution of cell population and nutrient concentration inside a bioreactor (geometry A) with a medium inlet velocity of 0.01 m/s. The final frame captures cell distribution at the end of 4 (physical) days – the time interval between snapshots (left to right) is 12.5 hours. The initial cell density was 100. The concentration contours can be observed to change continuously throughout the simulation. This is in contrast with physical systems with no cells inside where such behavior would not be possible after the flow becomes stationary beyond initial transients. This demonstrates the platform’s ability capture dynamic reciprocity.

