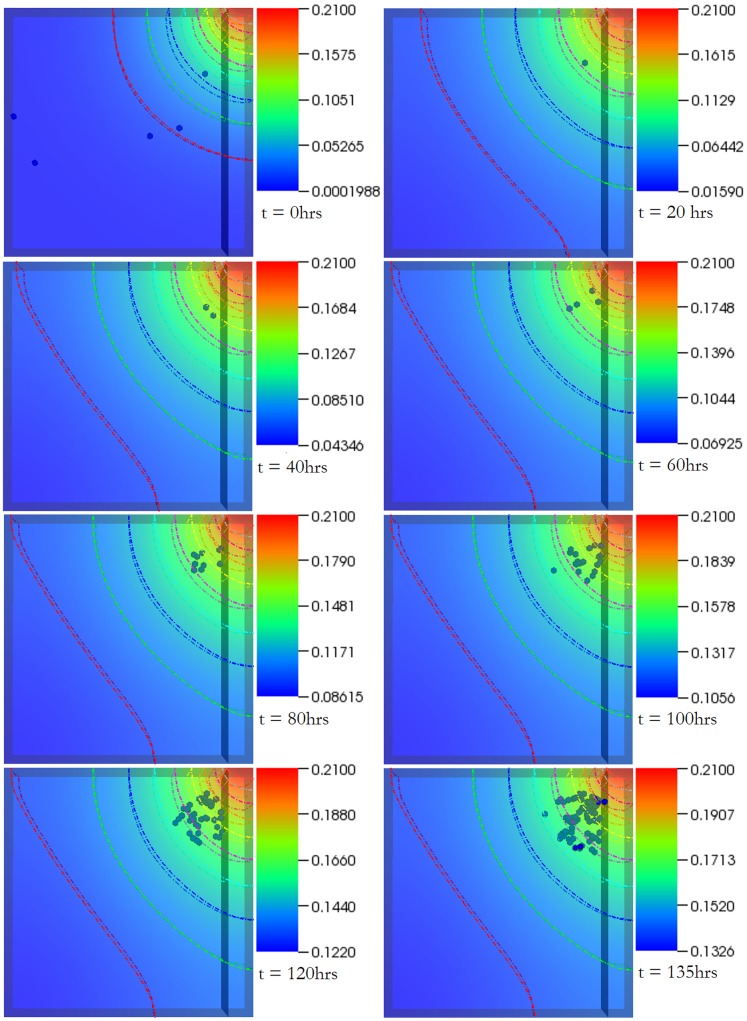
Figure 4. Case 3 results.
The figure shows temporal evolution of cell population and nutrient concentration inside a bioreactor (geometry B) with a medium inlet velocity of 0.001 m/s. The top right end of the bioreactor serves as the inlet whereas the entire left as well as bottom ends of the bioreactor serve as outlet. The initial cell density was 5. The time interval between snapshots (left to right) is 20 hours. The final frame captures cell distribution at the end of 6 (physical) days.

