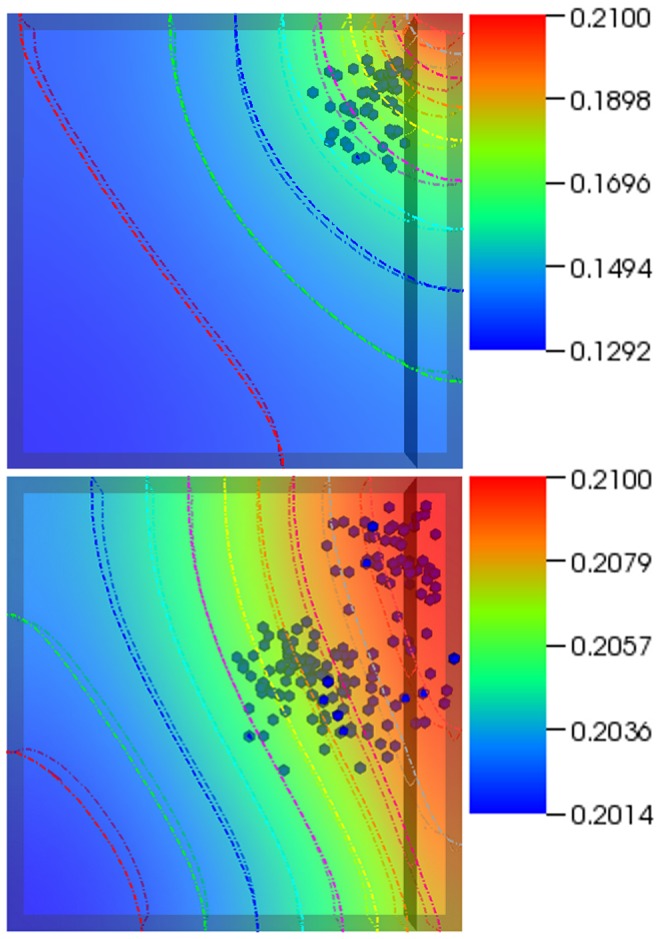
Figure 5. Different boundary conditions lead to different output.

The figure shows temporal evolution of cell population and nutrient concentration in the same bioreactor set at different medium inlet velocities; 0.001 m/s (top) and 0.01 m/s (bottom). The bioreactor on the right ends up with considerably higher number of cells and a distinct growth pattern. This displays the dynamic nature of the system and the dependence of the spatiotemporal evolution of the system on processes such as chemotaxis and apoptosis. The frames were recorded at 5.5 days.
