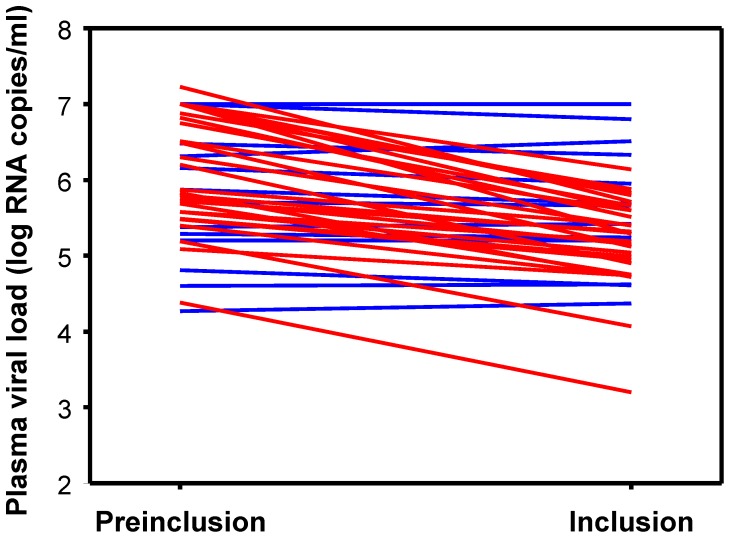
Figure 1. Time course of plasma viral load in PHI patients between the pre-inclusion visit (∼d-7) and inclusion of the study (d0).
Values for patients who experienced a decline of at least 0.3 log in their viral load (arbitrary threshold) during this period are shown in red, and those from patients whose viral load remained stable are in blue.

